

A spatiotemporal analysis of opioid prescriptions in Indiana from 2015 to 2019
- PMID: 40781687
- PMCID: PMC12335077
- DOI: 10.1186/s13011-025-00664-8
A spatiotemporal analysis of opioid prescriptions in Indiana from 2015 to 2019
Abstract
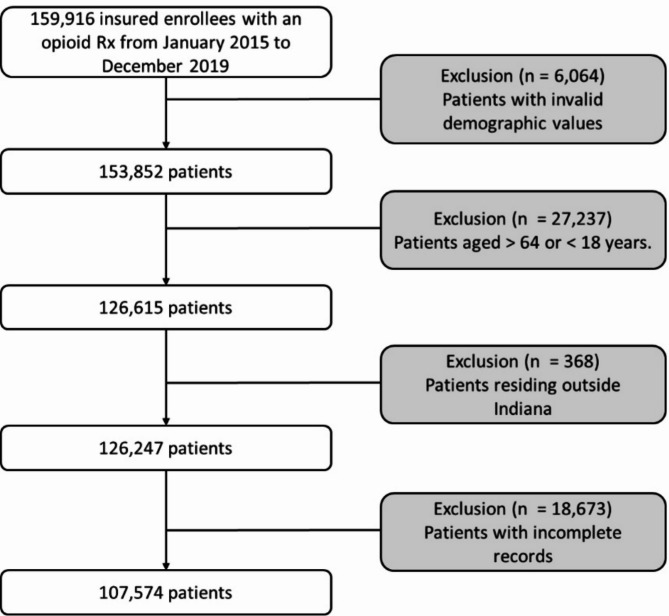
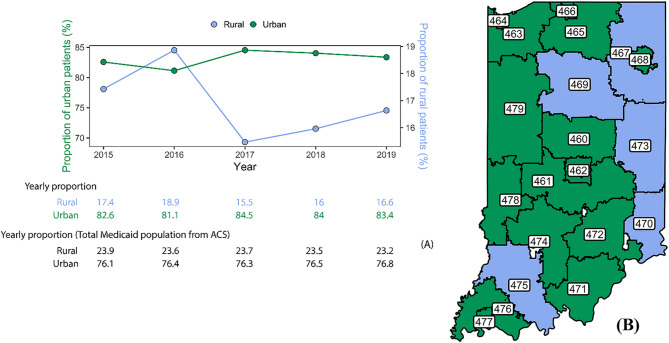
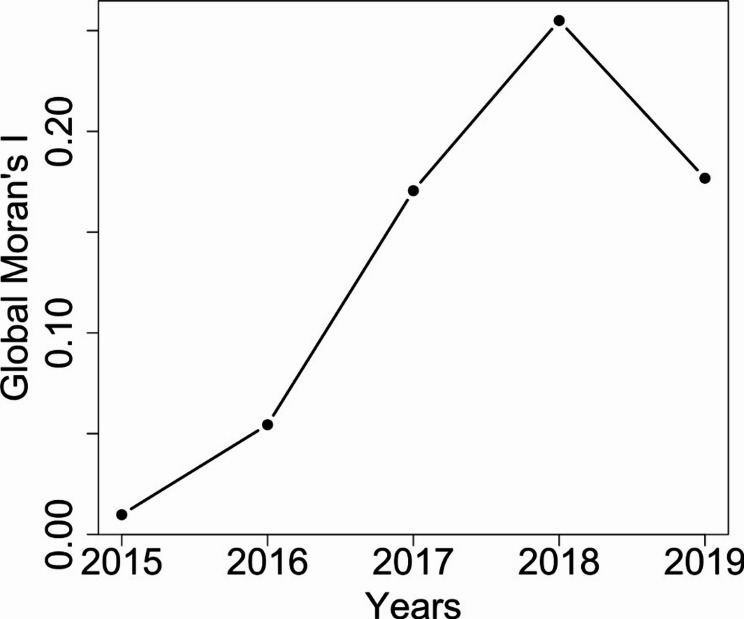
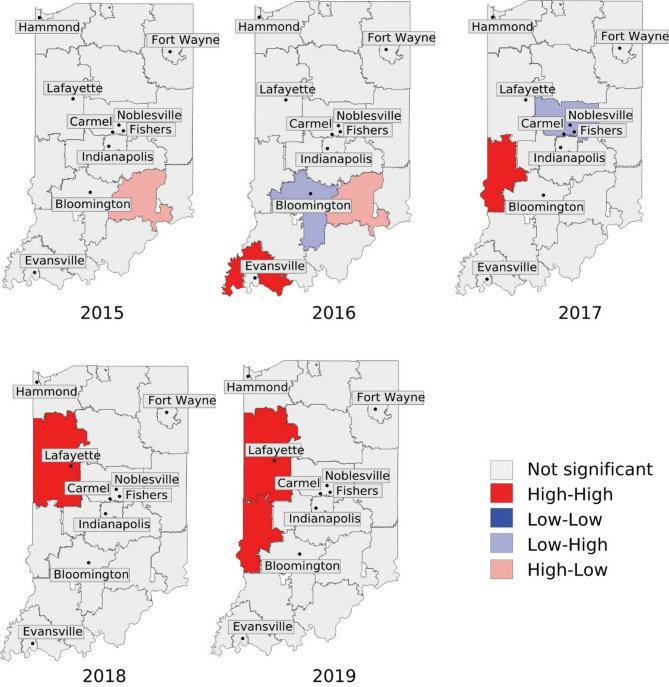
People living in rural communities are more likely to receive opioid prescriptions, partly due to job-related injuries. State-level interventions have reduced opioid prescribing; however, rural/urban disparities persist due to differences in demographics and prescribing practices, particularly in states with large rural populations like Indiana. While spatiotemporal analyses have explored aspects of the opioid crisis, spatiotemporal patterns of opioid prescribing have not been sufficiently studied. This study utilizes a sample of Medicaid claims data from the Indiana Family and Social Services Administration from 2015 to 2019 to analyze spatiotemporal patterns of patients receiving at least one opioid prescription across Indiana. The goal was to analyze patient demographics and track prescription hotspot movement over time in rural and urban areas. We analyzed data for 107,574 Medicaid enrollees who received opioid prescriptions during the study period. We found that most patients in the cohort resided in urban areas, with the number of patients who were prescribed opioids and resided in rural areas decreasing at a faster rate. We conducted a negative binomial regression analysis to examine the relationship between various demographics (sex, age, race/ethnicity, and urban/rural classification) and the number of patients receiving at least one opioid prescription over time. Our findings indicate that older patients, patients identifying as females, patients who identify as White, and patients living in urban areas, are more likely to receive at least one opioid prescription. Additionally, the interaction effects revealed that patients from all demographic groups were more likely to receive at least one opioid prescription if they lived in urban areas, compared to those living in rural areas. Using Local Moran's I as a local spatial autocorrelation measure, we identified clusters highlighting transitions from rural to urban areas over time. In 2015-2016, three significant clusters emerged within rural-surrounded 3-digit ZIP codes (472, 474, 476), based on the Rural-Urban Commuting Area Codes. Over time, significant clusters shifted towards urban or mixed areas, possibly influenced by state guidelines and legislation. These findings enhance the understanding of opioid prescription dynamics and identify patterns in opioid prescribing rates in terms of the proportion of patients receiving opioid prescriptions among urban vs. rural communities in Indiana.
Keywords: Geospatial analysis; Indiana; Moran's I; Opioid prescribing rates; Opioid prescriptions; Urbanicity.
© 2025. The Author(s).
Conflict of interest statement
Declarations. Ethics approval and consent to participate: The study was approved by the Purdue University Institutional Review Board (2019–118). Competing interests: The authors declare no competing interests. Conflict of interest: The author(s) declared no potential conflicts of interest with respect to the research, authorship, and/or publication of this article. Consent to publish: Not applicable.
Figures
Similar articles
-
Opioid Prescription Patterns 30 Days After Pediatric Supracondylar Humerus Fracture Closed Reduction and Percutaneous Pinning: 2010 to 2021.J Pediatr Orthop. 2025 Sep 1;45(8):e687-e692. doi: 10.1097/BPO.0000000000002993. Epub 2025 Jun 2. J Pediatr Orthop. 2025. PMID: 40454750
-
Sex Disparities in Opioid Prescription and Administration on a Hospital Medicine Service.J Gen Intern Med. 2024 Nov;39(14):2679-2688. doi: 10.1007/s11606-024-08814-7. Epub 2024 Aug 9. J Gen Intern Med. 2024. PMID: 39120670 Free PMC article.
-
Investigation and analysis of mental health status of the older adult in western rural areas.Front Public Health. 2025 Jul 16;13:1612600. doi: 10.3389/fpubh.2025.1612600. eCollection 2025. Front Public Health. 2025. PMID: 40740371 Free PMC article.
-
Drugs for preventing postoperative nausea and vomiting in adults after general anaesthesia: a network meta-analysis.Cochrane Database Syst Rev. 2020 Oct 19;10(10):CD012859. doi: 10.1002/14651858.CD012859.pub2. Cochrane Database Syst Rev. 2020. PMID: 33075160 Free PMC article.
-
Systemic pharmacological treatments for chronic plaque psoriasis: a network meta-analysis.Cochrane Database Syst Rev. 2021 Apr 19;4(4):CD011535. doi: 10.1002/14651858.CD011535.pub4. Cochrane Database Syst Rev. 2021. Update in: Cochrane Database Syst Rev. 2022 May 23;5:CD011535. doi: 10.1002/14651858.CD011535.pub5. PMID: 33871055 Free PMC article. Updated.
References
-
- Substance Abuse and Mental Health Services Administration. Key Substance Use and Mental Health Indicators in the United States: Results from the 2021 National Survey on Drug Use and Health. Center for Behavioral Health Statistics and Quality, Substance Abuse and Mental Health Services Administration 2022; Available from: https://www.samhsa.gov/data/report/2021-nsduh-annual-national-report
-
- Center for Disease Control. SUDORS Dashboard: Fatal Drug Overdose Data. 2024 [cited 2024 Jun 4]. Available from: https://www.cdc.gov/overdose-prevention/data-research/facts-stats/sudors...
-
- School of Medicine. and Health Sciences [Internet]. [cited 2023 Oct 30]. Effectiveness of Prescription Drug Monitoring Programs in the Emergency Department. Available from: https://urgentmatters.smhs.gwu.edu/news/effectiveness-prescription-drug-...
-
- Center for Disease Control. Overdose Prevention. 2024 [cited 2024 Jun 4]. United States Dispensing Rate Maps. Available from: https://www.cdc.gov/overdose-prevention/data-research/facts-stats/us-dis...
MeSH terms
Substances
LinkOut - more resources
Full Text Sources
Medical
