. 2025 Aug 8;16(1):437.
doi: 10.1186/s13287-025-04534-9.

Mesenchymal stromal cells conditioned by peripheral blood mononuclear cells exert enhanced immunomodulation capacities and alleviate a model of Myasthenia Gravis

Affiliations

Mesenchymal stromal cells conditioned by peripheral blood mononuclear cells exert enhanced immunomodulation capacities and alleviate a model of Myasthenia Gravis

Alexandra C Bayer et al. Stem Cell Res Ther. .

Abstract

Background: Mesenchymal Stromal Cells (MSC) possess innate immunomodulatory properties, which can be significantly enhanced through co-culture with peripheral blood mononuclear cells (PBMC), making them attractive tools for the treatment of autoimmune and inflammatory diseases.

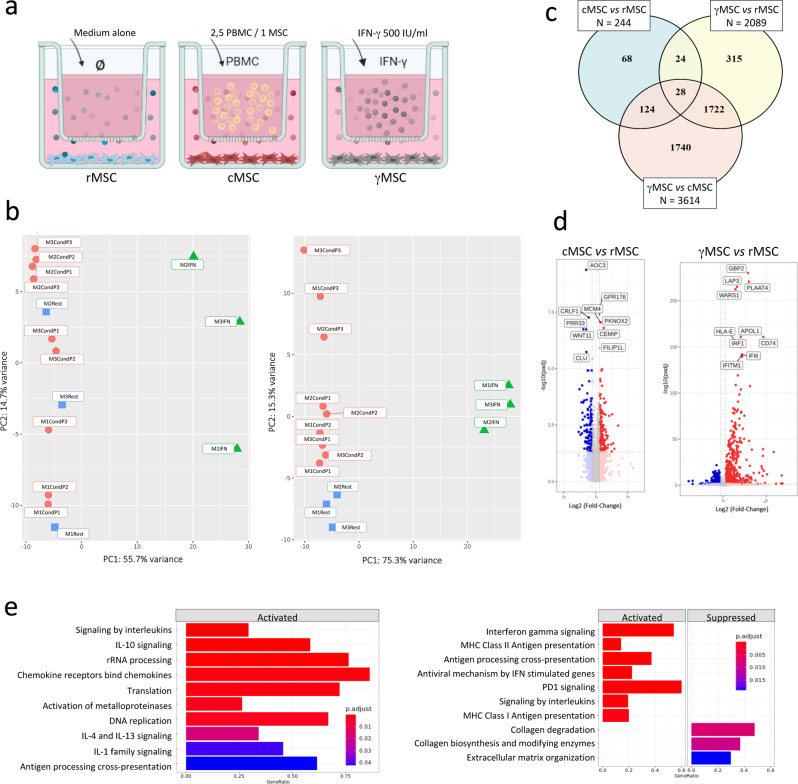
Methods: Leveraging a multi-omics approach encompassing RNA sequencing, flow and mass cytometry, secretome analysis, completed by functional evaluations, we investigated the mechanisms underpinning PBMC conditioning of MSC in vitro and their benefits in an animal model of Myasthenia gravis. MSC derived from human adipose tissue were left untreated in resting state (rMSC), conditioned by PBMC (cMSC), or activated by the pro-inflammatory molecule interferon (IFN)-γ (γMSC), then compared for their gene expression profiles, phenotypes and functional capacities.

Results: RNA sequencing identified 244 differentially expressed genes in cMSC compared to rMSC, highlighting key immune mediators such as CCL2, CCL11, DPP4, ICAM1, IL6, PDCD1LG2, TNFRSF11B, TNIP1, TNIP3 and ZC3H12A and pinpointing genes involved in matrix remodeling, paracrine and autocrine communications. Comparatively, 2089 genes were differentially expressed between rMSC and γMSC, highlighting host defense, anti-viral response, NFκB signaling pathways modulated by IFN-γ. Flow and mass cytometry analyses revealed upregulation of the surface markers CD26, CD54, and CD273 and intracellular molecules IDO1 and PTGS2 in cMSC. In contrast, IFN-γ activation predominantly increased HLA-related markers while also enhancing the homogeneity of the populations. Together, these results underlined the treatment dependence of transcriptomic and phenotypic signatures. Secretome profiling identified 6 categories of modulated proteins, out of which 22 molecules potentially involved in PBMC conditioning and 40 implicated in cMSC-mediated immunomodulation. Functionally, cMSC induced modulation in PBMC subsets, raising the proportions of lymphocyte populations (CD4 Treg, CD8, B memory), underlining the multimodal effect of conditioning. Also, both a direct cell-cell contact and cMSC supernatants significantly suppressed activated T-cell proliferation in vitro. To confirm immunomodulation efficacy in vivo, cMSC were administrated to our humanized mouse model of Myasthenia Gravis and the treatment significantly halved disease severity from 2 weeks post-injection.

Conclusions: This integrative study establishes distinct conditioning signatures, suggests molecular mechanisms, and underscores the therapeutic potential of cMSC, offering a robust framework for advancing cell-based therapies in autoimmune diseases.

Keywords: Conditioning; Humanized mouse model; Immunomodulation; Inhibition of proliferation; Mass cytometry; Mesenchymal stromal cells; Myasthenia gravis; RNASeq; Secretome; γ-Interferon.


Conflict of interest statement

Declarations. Ethics approval and consent to participate: Human adipose-derived MSC were obtained in the context of two successive clinical trials and used as res nullius. (1) The title of the aproved projects were ADIPOA (A Phase I, Prospective, bi-centric, single-arm, open-label, dose-escalating clinical trial to evaluate the safety of a single injection of autologous adipose derived mesenchymal stromal cells in the treatment of severe osteoarthritis of the nee joint) and ADIPOA-2 (A study evaluating the efficacy of a single injection of autologous adipose derived mesenchymal stromal cells in patients with knee osteoarthritis). (2) They were authorized by the Personal Protection Committee of Montpellier, France, UF 606-120203. (3) The registered numbers are NCT01585857 and NCT02838069. (4) The projects were approved on 12/2011 and 09/2016. According to the French laws and regulations, the patients provided written informed consent for use of their cells and were anonymized. AChR+MG thymic fragments were provided by medical collaborators with the authorization of a French Ethical Committee. (1) The title of the approved project was MYA-PATH (Constitution of a collection of biological resources for the study of pathologies that could lead to autoimmune myasthenia). (2) It was authorized by the Personal Protection Committee of Tours, Central West Region 1, France, IRB n° IORG0008143 OMB: 0990 − 0279, (3) under agreement number 2019-A01482-55, (4) in date of 11/20/2019. The patients were undergoing thymectomy and gave written informed consent for the use of res nullius samples obtained during surgeries and anonymized according to the French laws and regulations. Whole blood bags were procured by the French Blood Establishment (EFS Ile de France) to prepare PBMC according to the convention CCPSL UNT– N° 18/EFS/033 authorized on 16/08/2018 between our Institutions. According to French laws and regulations (article R.1222-40/2 of the Public Health Code), the EFS collect and distribute blood elements prepared from donors, whose gift is free and anonymous, and who gave written informed consent for their use. No further IRB was required. Animal experimentations have been designed to respect the 3R principles according to the Directive 2010/63/EU of the European Union and received the APAFIS authorizations number 02622.2 (Evaluation of cellular and pharmacological therapeutic strategies in the experimental mouse model of Myasthenia gravis, 20/11/2015) and number 30172 (Set up of cellular therapy strategies in two experimental mouse models of Myasthenia gravis, 21/05/2021), from the French Ministry of Higher Education and Research under agreement of the local Ethical Committee (CEEA 005, Charles Darwin). Experimentations were performed under supervision of personals authorized by French Authorities in the animal facility of the Sorbonne University (EU 0144, Agreement C-75-13-20). Consent for publication: Not applicable. Competing interests: The authors declare that they have no competing financial or personal interests that could have influenced the work reported in this article.

Figures

Fig. 1
Fig. 1
Gene signature of MSC under different treatments RNA sequencing analysis was conducted under different treatments. (a) Schematic representation of the different cell samples used for RNAseq study: non-stimulated MSC (rMSC, n = 3), MSC obtained after coculture with PBMC for 72 h (cMSC, n = 9 combinations) and MSC after stimulation with 500U/ml of INF-γ for 48 h (γMSC, n = 3 cultures). (b) PCA analysis of 500 most variable genes in the transcriptome before (left) and after (right) removal of batch effects from donor using the removeBatchEffect from the limma v3.50.3 package. (c) Venn diagram showing the number of shared and unique differentially expressed genes (DEG) found between compared conditions. The total number of DEG is shown in cases attached to each diagram. (d) Volcano plots visualization of RNAseq data comparing cMSC versus rMSC (left) and γMSC versus rMSC (right). The top 10 DEG with highest padj value were annotated. (e) Most pertinent activated (or suppressed) pathways, determined from GSEA. Each plot displays pathways in Reactome and Gene Ontology Biological process (GO_BP) collections in cMSC (left) and γMSC (right) when compared to rMSC. Bar height represents gene ratio and bar color the padj value
Fig. 2
Fig. 2
Gene expression assessment by RT-PCR. Gene expression was first normalized to the reference gene GAPDH and then presented as mRNA expression relative to rMSC of each culture. The graphs are grouped in categories, according to the expression of the given gene under the effect of treatment. (a): increased by PBMC conditioning; (b) decreased by PBMC conditioning; (c): increased by IFN-γ; (d): increased by both treatments; (e): no effect. Data were analyzed using One-way ANOVA and are presented as mean ± standard error of the mean. The top bar compares rMSC and γMSC, the bottom bars compare cMSC with rMSC and γMSC. *P ≤.05, **P ≤.01, ***P ≤.001, ****P ≤.0001
Fig. 3
Fig. 3
cMSC phenotypical signatures established by flow cytometry. rMSC (n = 4), cMSC (n = 15), and γMSC (n = 4) were analyzed for the expression of extracellular markers using flow cytometry. Differences in the expression of markers between conditions are represented as fold-changes of their respective rMSC counterparts, represented by dashed lines. (a) Markers up-regulated by PBMC conditioning; (b) Marker increased by both PBMC conditioning and IFN-γ priming. (c) Markers decreased by PBMC conditioning, or (d) differentially regulated according to treatment; (e) Markers up-regulated by IFN-γ priming; (f) Marker decreased by IFN-γ priming; (g) Markers showing no significant evolution, and/or high variability among experiments. Data were analyzed with One-way ANOVA test. Statistical significance between cMSC and rMSC are represented at the top of figure by stars: *P ≤.05, **P ≤.01, ***P ≤.001, ****P ≤.0001. Statistical significance between cMSC and γMSC are represented at the bottom of figure by hashtags: #P ≤.05, ##P ≤.01, ###P ≤.001, ####P ≤.0001
Fig. 4
Fig. 4
Unsupervised and supervised analysis of MSC phenotypic profile by CyTOF rMSC (n = 4), cMSC (n = 22), and γMSC (n = 4) were barcoded and stained with a dedicated home-made panel and analyzed by CyTOF. Data analysis was performed using Omiq software. (a) Table showing barcoding strategy based on CD90 staining. Each sample was identified by a unique combination of 3 different metal-tagged CD90 Ab, then samples were distributed in 2 tubes gathering 15 each. (b) Unsupervised optimized t-Distributed Stochastic Neighbor Embedding (Opt-SNE) plot overlaying rMSC, cMSC and γMSC samples. (c) Scatterplot showing metaclusters yield by each MSC condition. Ten metaclusters were identified using ClusterX analysis tool and each one is represented by a different color and identified by a number. (d) Histogram showing the frequency of cells in each of the identified metaclusters for each MSC condition. Most cells (> 50%) were belonging to clusters 1, 4, 5 in resting conditions. Most cells were belonging to clusters 3, 8, 9 and 10 after PBMC conditioning. The most important difference between resting and conditioning was observed in cluster 10. Following IFN-γ priming, most cells were concentrated in clusters 2 and 7. (e) Volcano plots presenting the significantly modulated clusters between 2 conditions: rMSC versus cMSC (left), rMSC versus γMSC (middle) and γMSC versus cMSC (right) (cut-off p value ≤ 0.05). (f) Heat-map showing the expression of markers for each metacluster, expressed in mean mass intensity units. The color intensity (red or blue) reflects the relative weight of a given value in its column, from the highest in intense red to the lowest in intense blue
Fig. 5
Fig. 5
Characterization of MSC secretome Supernatants produced by MSC alone, by PBMC alone, by the culture media alone, by MSC during coculture with PBMC, and by D3-cMSC after coculture, were analyzed for the secretion of 609 different proteins using proximity extension assay methodology (Olink). Data were obtained as NPX value (Normalized Protein eXpression, Olink’s arbitrary unit expressed in Log2 scale) and explored using Olink® Insights Stat Analysis app (www.olink.com). (a) Representation of the different samples set-ups used for supernatant preparation and the categories. Color codes were established for each sample type and used throughout this figure. (b) PCA plot of samples based on the differentially secreted proteins identified between at least two categories (n = 177). Data analysis was performed using One-way ANOVA and padj of 0.01 as cut-off. (c) Heat-map showing the detection of the 177 differentially secreted proteins in the different samples. P identify the PBMC samples (P1 to P3), Med identify the culture medium alone, M identify the MSC culture (M1 to M4). In cocultures the number of the MSC culture (M1 to M4) is associated to the PBMC sample (P1 to P3). The cultures harvested and replated for 3 days are identified by D3 followed by the number of the initial coculture. The columns correspond to the samples while the rows correspond to the proteins. Rows are centered and unit variance scaling is applied to them. Both rows and columns are clustered using correlation distance and average linkage, only columns dendrograms are shown for simplification. Color intensity of each grid represents the numeric differences expressed as Z-score. (d) Typical representations of the different groups in which the differentially secreted proteins were classified. Each group is illustrated by an example protein whose secretion profile is characteristic of the group profile, i.e. EGF plot shows the typical general secretion profile of molecules identified as “consumed by MSC”. The colored lines represent the analysis of significance between each category of sample and significances are indicated above each category. Each line color corresponds to the compared category, e.g. the green line corresponds to the comparison between medium and all other categories. The pink line corresponds to the comparison between PBMC and rMSC, coculture and D3-MSC. The blue line corresponds to the comparison between rMSC, coculture and D3-MSC. The red line corresponds to the comparison between coculture and D3-MSC. *P ≤.05, **P ≤.01, ***P ≤.001, ****P ≤.0001, ANOVA one-way test. (e) Volcano plot showing differentially expressed molecules upon comparison of coculture and rMSC supernatants (top), and comparison of D3-cMSC and rMSC supernatants (bottom). Representation’s cut-offs were set at log2 (1.5) (i.e. 0.6) for the fold-change and–log10 (0.05) (i.e. 1.2) for the p value. Significantly upregulated proteins are shown in red, significantly down-regulated proteins in blue and non-significantly modulated proteins in grey
Fig. 6
Fig. 6
Functional assessments in vitro: changes in PBMC subsets during conditioning and capacity to inhibit proliferation. (a) PBMC used for MSC conditioning (n = 15 to 16) were harvested after the coculture step and analyzed by CyTOF using the Maxpar Direct Immune Profiling Assay™. PBMC samples cultured in growth medium alone were used as controls (n = 4). Changes in PBMC cell subsets after coculture are shown as fold-change relative to control PBMC. Statistical significance between conditions (Mann-Whitney test) is represented by stars: *P ≤.05, **P ≤.01, ***P ≤.001. (b) Set-up of the T cell inhibition assay. PBMC were incubated with CFSE and stimulated with microbeads-coupled anti CD3+/CD28+ Ab. The inhibition of T cell proliferation was assessed by flow cytometry. The histograms show representative proliferation profiles of non-activated PBMC (top left) and PBMC activated by CD3+/CD28+ coated beads (top right), and the profiles obtained in contact with supernatants produced by rMSC (bottom left), D3-cMSC (bottom middle), and γMSC (bottom right) respectively. Each green pic represents a daughter cell generation. (c) Inhibition of the proliferation of total T cells (left), CD4+ T cells (middle) and CD8+ T cells (right) after culture with supernatants from rMSC, D3-cMSC and γMSC. (d) Proliferation of T cells in absence of, or in direct contact with, MSC from the different conditions. The 50% inhibition is indicated by a discontinued line. (e) Proliferation of T cells when incubated with MSC supernatants from different conditions in presence or absence of saxagliptin (SAX), an inhibitor of CD26/DDP4. Data were analyzed using One-way ANOVA. ***P ≤.001, ****P ≤.0001
Fig. 7
Fig. 7
cMSC treatment effect in the NSG-MG mouse model. (a) Timeline of the treatment of the animal model indicating frequency of tests, and treatment of mice relative to thymus fragment grafting. rMSC or cMSC cells (5.105) or vehicle (NaCl) were injected in NSG-MG mouse model in a blinded fashion (n = 27; 9 animals per treatment group) and the effect of treatment was tracked through composite clinical score assessment calculated based on weight loss, grip test, inverted grid test and behavior observation. (b) Integration of the weekly general clinical score (GCS) evolution. For each mouse the weekly registered GCS was normalized to its initial GCS (obtained at the onset of the disease, week 2). One mouse in the placebo group did not present humanization and was removed, therefore the analysis was done using n = 8 for this group. Normality of distribution in each treatment group was assessed (D’Agostino & Pearson test). Significant differences were observed between vehicle and cMSC–injected animals at 4, 5 and 6 weeks. Data were analyzed using two-way ANOVA multiple comparisons (Tukey’s test) and are presented as mean ± standard error of the mean. *P ≤.05, ***P ≤.001
Fig. 8
Fig. 8
Integrated view of conditioning: induction by PBMC-MSC coculture, proposed mechanisms and immunomodulatory effects. From left to right are presented the proposed effectors, and the targets of the effects. In the center, MSC in culture continuously produce their own constitutive products (exemplified here as Col1A1, MCP-1…), expanding on both left and right sides of the figure. The interaction between MSC and PBMC produce some potentially conditioning molecules (exemplified here as AZU-1, IL-16, CCL3, CCL4, MPO, TNFα…) which act on the MSC (left side). This triggers changes in the expression of some MSC genes involved in specific pathways (NF-kB…), the expression of proteins at the membrane (CD26, CD54, CD273, CD318) or of secreted proteins proposed to participate to immunomodulation (right side, exemplified here as CHI3L1, Gal-1, Gal-3, Fas, Il-1RA, IL-6, MMP7, PD-L1, Thy-1, secreted form of CD26, IDO-1). Conditioned MSC also produce extracellular vesicles whose role was not investigated in this study. These molecules target the cells of innate and adaptive immunity, on the right part of the Figure, with various impacts depending on the nature of cells (exemplified by the overall reduction of T cell proliferation but the increase in Treg populations, the increase in B memory cells, and potential other targets). Figure done using Biorender

Similar articles

References

    1. Andreeva E, Bobyleva P, Gornostaeva A, Buravkova L. Interaction of multipotent mesenchymal stromal and immune cells: bidirectional effects. Cytotherapy. 2017;19(10):1152–66. - PubMed
    1. Baharlooi H, Azimi M, Salehi Z, Izad M. Mesenchymal stem cell-derived exosomes: A promising therapeutic Ace card to address autoimmune diseases. Int J Stem Cells. 2020;13(1):13–23. - PMC - PubMed
    1. Ben-Ami E, Berrih-Aknin S, Miller A. Mesenchymal stem cells as an Immunomodulatory therapeutic strategy for autoimmune diseases. Autoimmun Rev. 2011;10(7):410–5. - PubMed
    1. Ménard C, Tarte K. Immunoregulatory properties of clinical grade mesenchymal stromal cells: evidence, uncertainties, and clinical application. Stem Cell Res Ther. 2013;4(3):64. - PMC - PubMed
    1. Andrzejewska A, Lukomska B, Janowski M. Concise review: mesenchymal stem cells: from roots to boost. Stem Cells. 2019;37(7):855–64. - PMC - PubMed

Substances