. 2025 Aug 9;44(1):232.
doi: 10.1186/s13046-025-03488-3.

Targeting NOTCH1-KEAP1 axis retards chronic liver injury and liver cancer progression via regulating stabilization of NRF2

Affiliations

Targeting NOTCH1-KEAP1 axis retards chronic liver injury and liver cancer progression via regulating stabilization of NRF2

Chunxiao Chang et al. J Exp Clin Cancer Res. .

Abstract

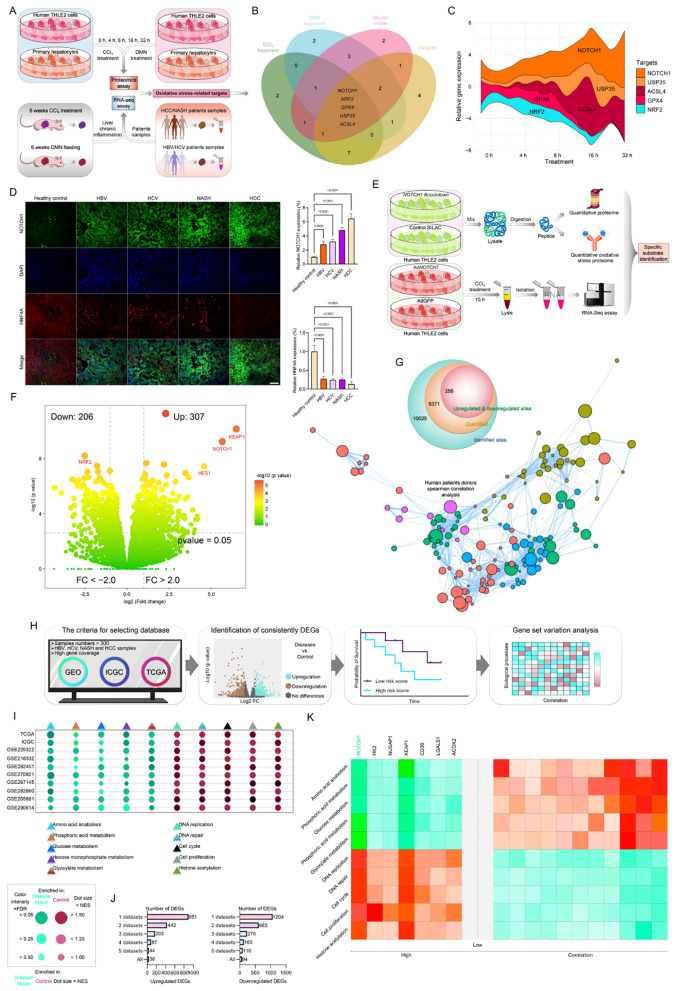
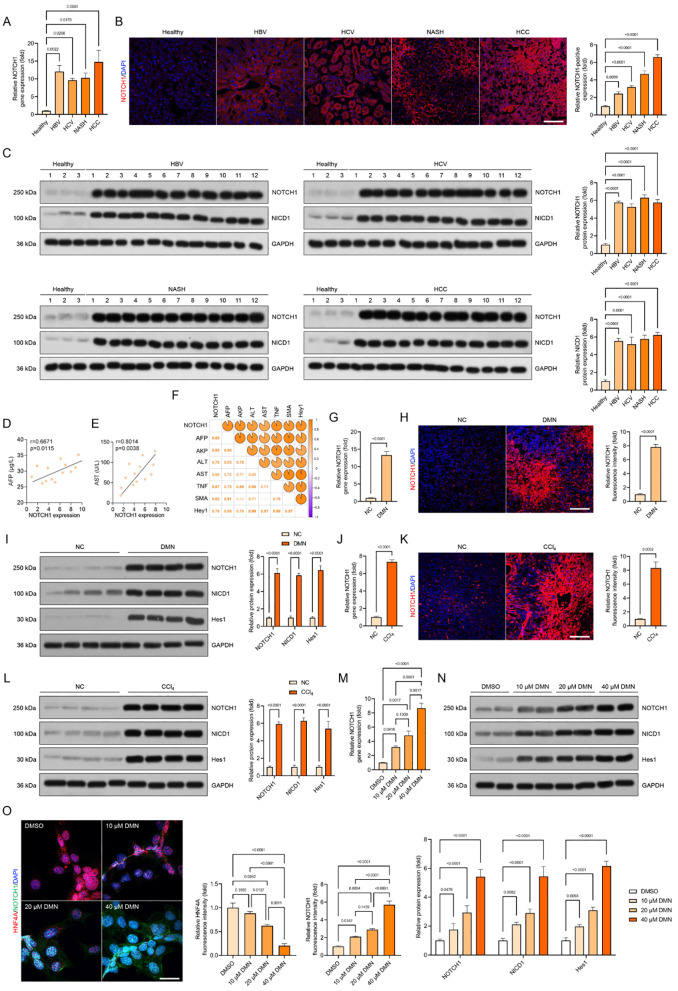
Background: Chronic liver injury is a key factor in diseases like hepatocellular carcinoma (HCC), steatohepatitis (NASH), and viral hepatitis type B and C (HBV, HCV). Understanding its molecular mechanisms is crucial for effective treatment. The NOTCH1 signaling pathway, though not fully understood, is implicated in liver injury and may be a potential therapeutic target.

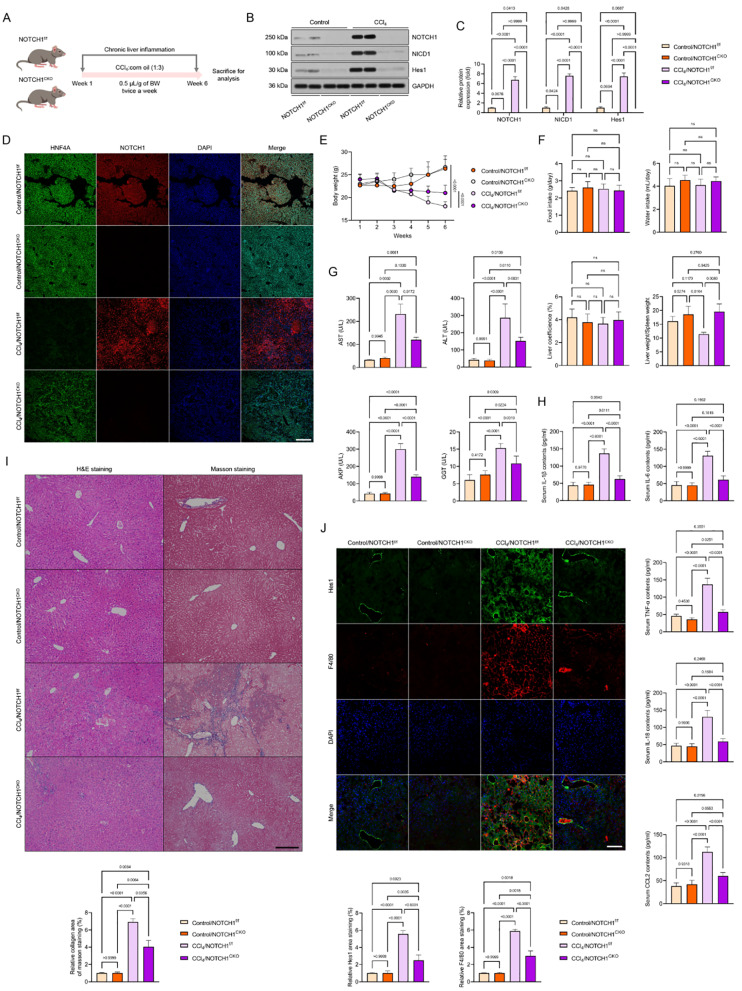
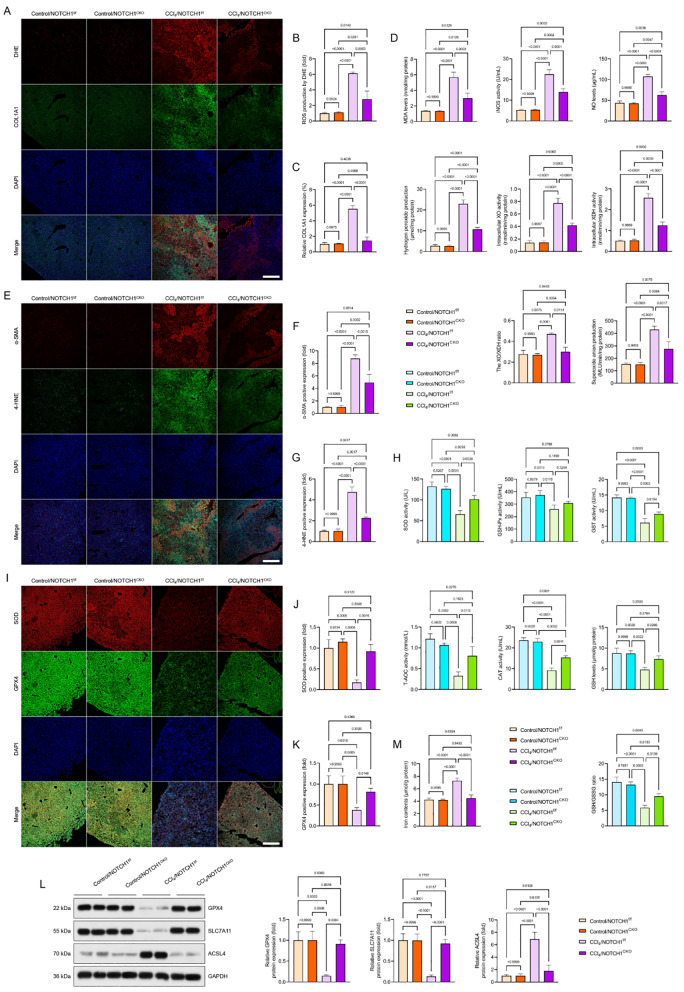
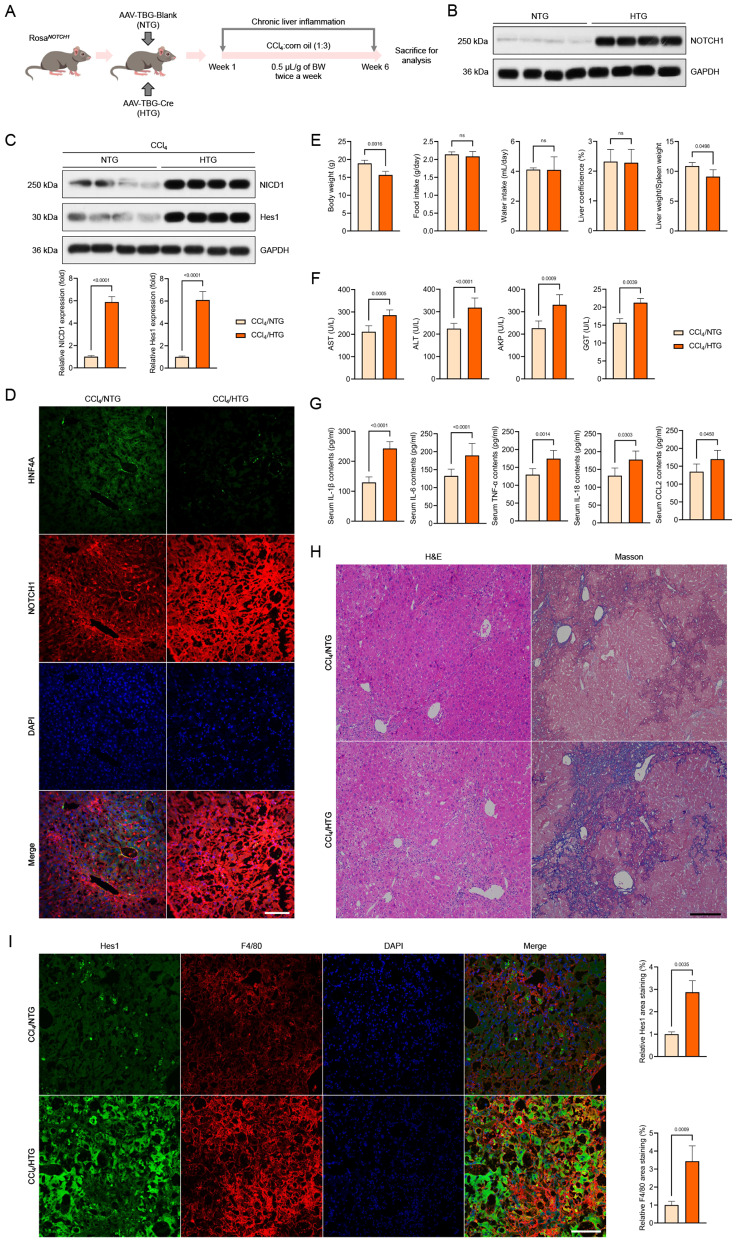
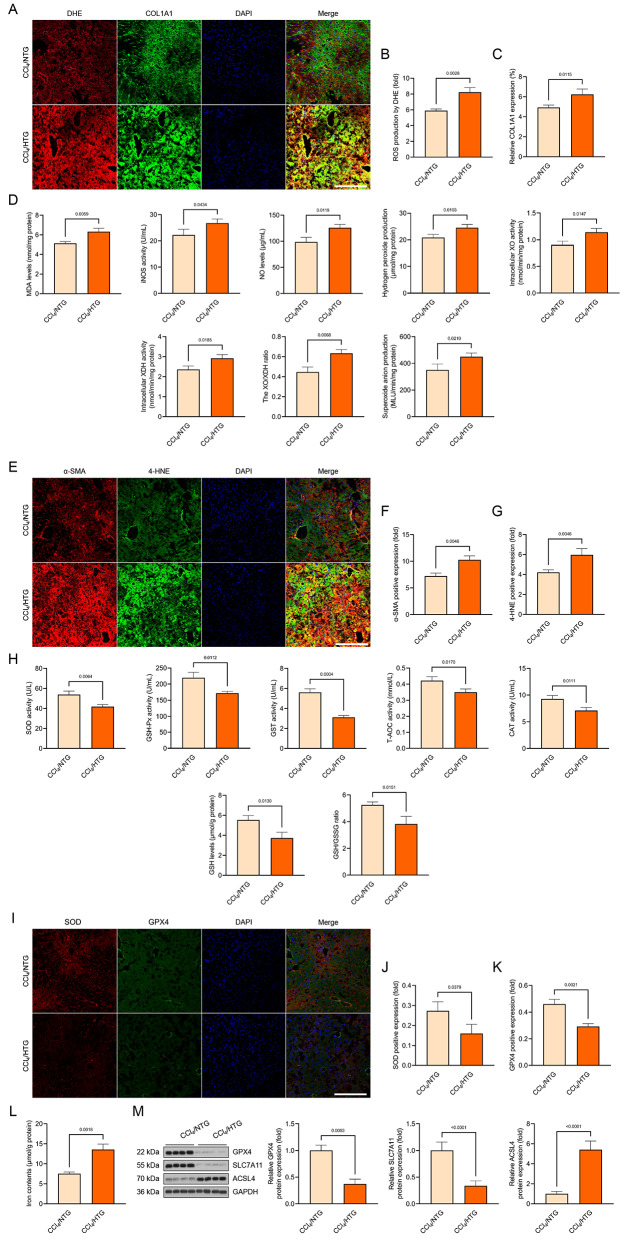
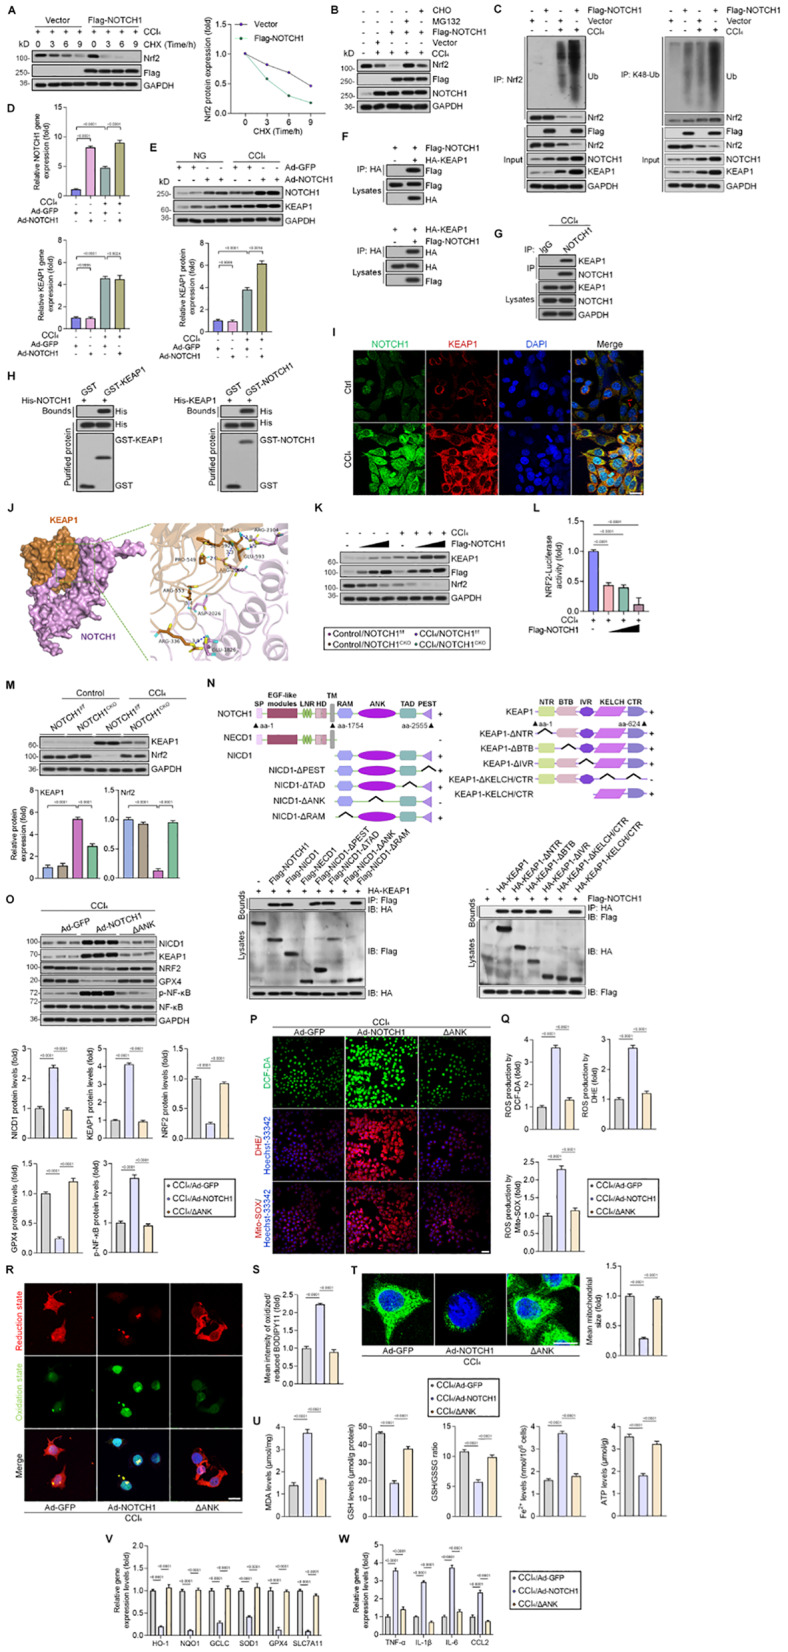
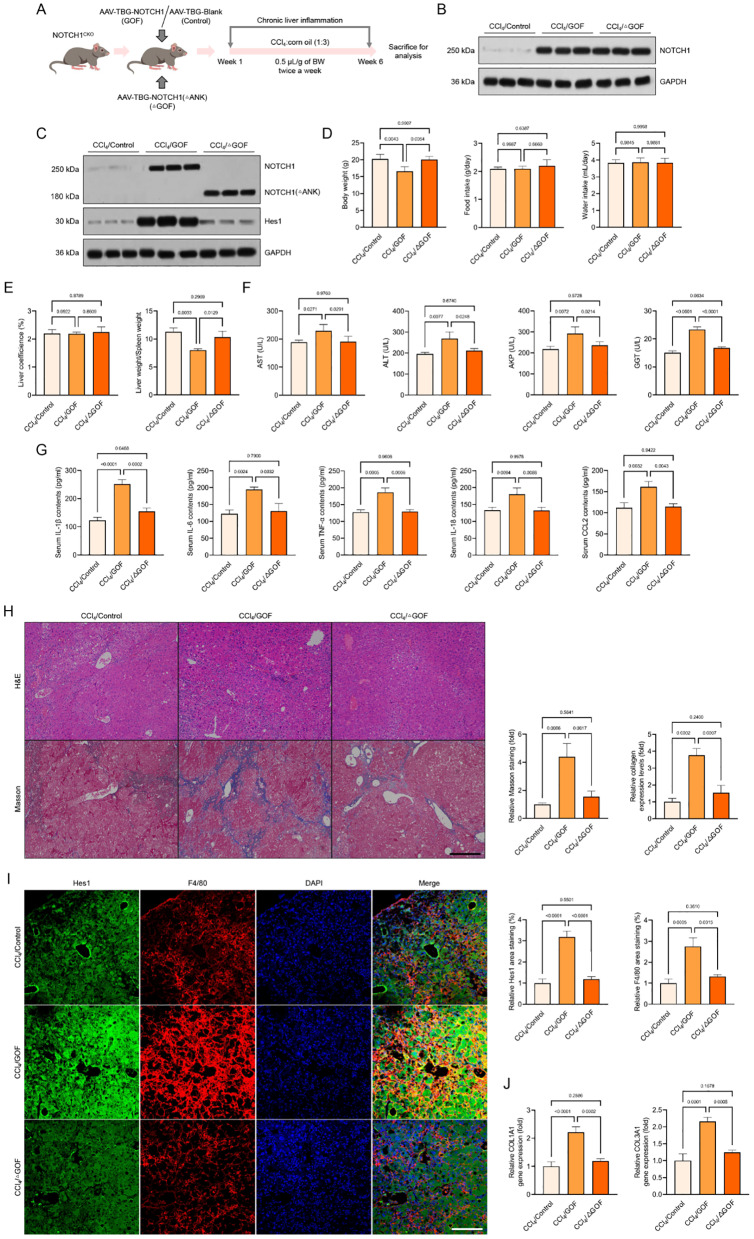
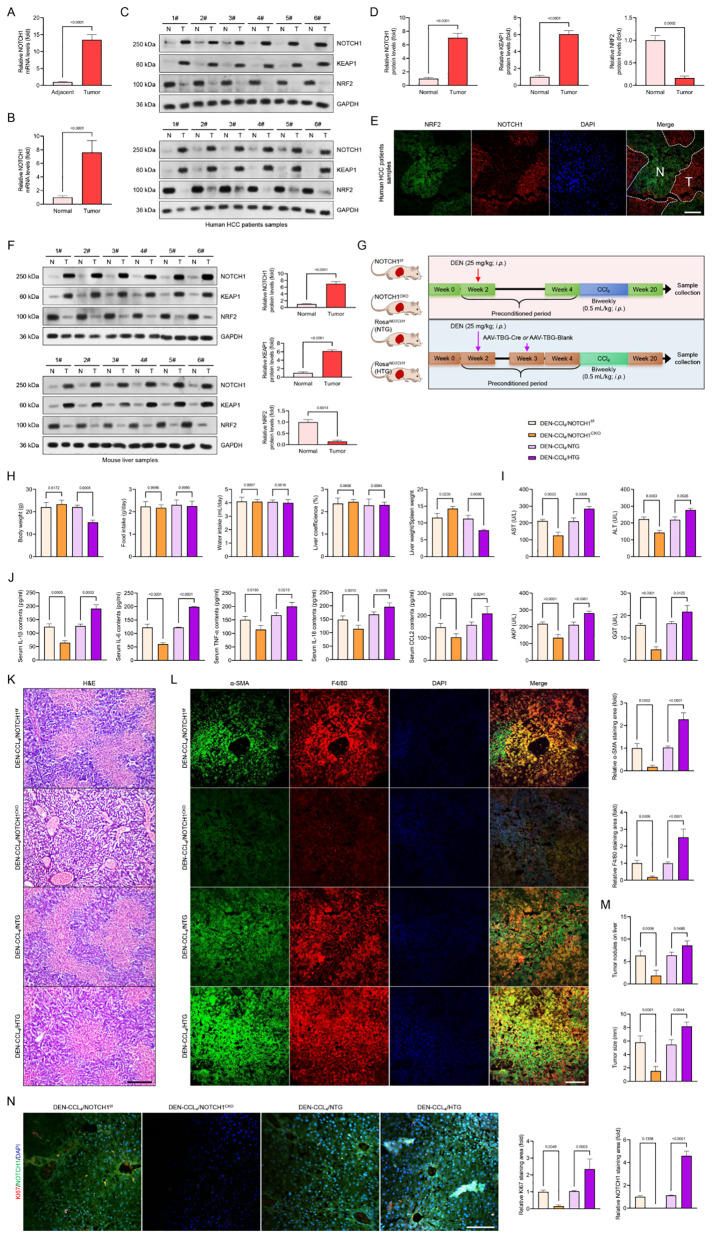
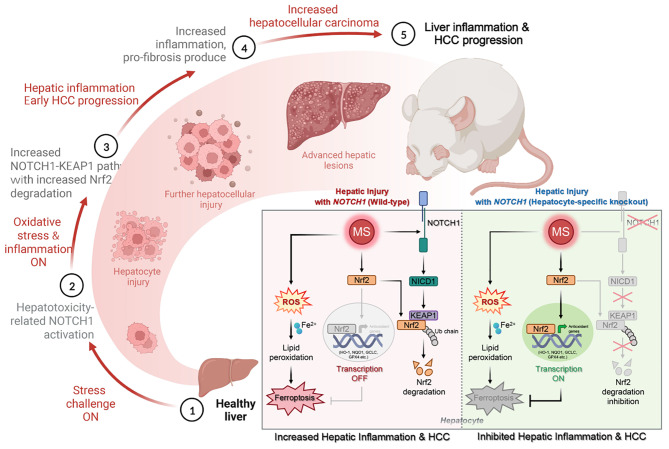
Methods: Clinical HCC, HBV, HCV and NASH samples and additional in vitro and in vivo performances were subjected to confirm the role of NOTCH1 and its downstream targets via a series of biochemical assays, molecular analysis approaches and targeted signaling pathway assay, etc. RESULTS: The present study first verified the abnormal elevation of NOTCH1 in hepatocytes from patients with steatohepatitis, HCC, HBV, HCV, and mouse models. Crucially, we discovered that hepatocyte-specific NOTCH1 knockout reduces hepatocellular damage in chronic liver inflammation and HCC mouse models, whereas adeno-associated virus serotype 8 (AAV8)-mediated NOTCH1 overexpression in hepatocytes exacerbates liver injury-related phenotype on-setting. Mechanistically, we showed that NOTCH1 has a new role in controlling ferroptosis and oxidative damage in hepatocytes. It interacts with Kelch-like ECH-associated protein 1 (KEAP1) and is directly recruited through its intracellular domain (NICD1). Additionally, the KEAP1 recruited by NOTCH1 impeded the binding stability of KEAP1-NFE2 like BZIP transcription factor 2 (Nrf2), promote the separation of KEAP1 and Nrf2, thereby reducing the stability of Nrf2 and hindering the ubiquitination-related proteasome degradation of Nrf2. Crucially, we also discovered that NOTCH1's ANK domain is essential for NICD1-KEAP1 contacts and signaling activation. The inability of NOTCH1 with ANK domain mutants (ΔANK) to connect with KEAP1 and increase its expression emphasizes the importance of the ANK domain in KEAP1-NRF2 signaling. By reversing the downregulation of KEAP1 and the overexpression of NRF2, ANK function is linked to ferroptosis and ROS buildup. ANK domain targeting may slow the course of HCC and liver damage.

Conclusions: Targeting the NOTCH1-KEAP1-NRF2 axis as a possible chronic hepatic injury therapy is supported by these findings, which identify NOTCH1-KEAP1 as an NRF2 suppressor that accelerates the progression of liver injury.

Keywords: Chronic liver inflammation; Ferroptosis; Hepatocellular carcinoma (HCC); NOTCH1; Nrf2.


Conflict of interest statement

Declarations. Ethics approval and consent to participate: The use of clinical samples was approved by the ethics committee of Shandong First Medical University & Shandong Academy of Medical Sciences and informed consent were obtained from all patients (2024LC0001). All animal experimental protocols were performed following the Ethical Animal Care and Use Committee of Shandong University (2022JJCA08). Consent for publication: All authors consent to the publication of this article. Competing interests: The authors declare no competing interests.

Figures

Fig. 1
Fig. 1
Identification of potential indicators involved in chronic liver inflammation and hepatocellular carcinoma (HCC)-related biological processes. (A) Experimental design showing the protocol of identifying oxidative stress-associated indicators in response to time-course of 1% CCl4-, 10 mM DMN-induced human THLE2 cells and mouse primary hepatocytes, or in 6-weeks of CCl4 (0.5 µL/g BW)- or DMN (0.5 mg/kg BW)-fed WT mice, or in liver samples from HCC, NASH, HBV, and HCV patients. (B) Venn diagram showing the Top 5 distinguishable expressed oxidative stress-associated candidates (i.e., NOTCH1, NRF2, GPX4, USP35 and ACSL4) in intersection of 4 separate samples data-set. (C) Waterfall streamgraph showing the relative mRNA expression profile of the 5 genes in the indicated groups. (D) Representative immunofluorescence images of NOTCH1 and HNF4A co-expression in lives of human samples with healthy control, HBV, HCV, NASH and HCC phenotype with fluorescence intensity measurement (magnification, 100×, n = 10 samples). (E) The flowchart showing the experimental procedure for the quantified proteome and protein interaction assay of NOTCH1. (F) Volcano plot indicating genes expression variation in human THLE2 cells after CCl4 treatment. (G) Number of identified oxidative stress-related upregulated & downregulated sites. (H) A screening protocol to highlight assumed gene candidates. (I) The physiopathology and biological processes associated with metabolism of HBV, HCV, NASH, and HCC samples were found to differ from those of controls in a number of databases, including TCGA, ICGC, and the NCBI Gene Expression Omnibus (GEO) datasets (GEO: GSE225322, GSE218332, GSE282451, GSE270921, GSE267145, GSE282660, GSE205881, and GSE290614). (J) The total number of differentially expressed genes that crossed over into different databases was tallied after gene differential expression analysis. (K) The molecular pathways influencing metabolism and the beginning of liver diseases are represented by seven upregulated DEGs. Data are presented as mean ± SEM. The associated experiments were performed independently at least three times. P < 0.05 indicates statistical significance
Fig. 2
Fig. 2
NOTCH1 (NICD1) signaling is enhanced in liver samples of chronic liver injury patients and mice. (A) Relative gene expression analysis of NOTCH1 in liver specimens from patients with HBV, HCV, NASH and HCC pathological phenotype (n = 12 samples). (B) Representative immunofluorescence images of NOTCH1 expression in liver samples of patients with HBV, HCV, NASH and HCC pathological phenotype (magnification, 100×, n = 10 samples). (C) Representative western blotting showing the NOTCH1 and NICD1 protein expression in liver samples isolated from patients with HBV, HCV, NASH and HCC pathological phenotype (n = 12 samples). (D, E) Pearson’s r correlation analysis of AFP levels and NOTCH1 levels, and AST contents and NOTCH1 levels in patients (n = 12 samples). (F) Multiple Pearson multiple correlation analysis for human subjects showing the comprehensive correlation between NOTCH1 protein expression levels and indicated parameter indexes (n = 12 indices each parameter). Utilizing DMN- and CCl4-induced mice, NOTCH1 expression alterations were investigated in mouse models with liver samples. (G) Relative gene expression assay of NOTCH1 in livers of control group (NC) and DMN-treated group (n = 10 samples). (H) Representative immunofluorescence images of NOTCH1 expression in liver samples of NC and DMN group (n = 10 samples). (I) Western blotting analysis showing the NOTCH1, NICD1 and Hes1 expression in liver tissue isolated from indicated groups (n = 4 samples). (J) Relative gene expression assay of NOTCH1 in livers of control group (NC) and CCl4-induced group (n = 10 samples). (K) Representative immunofluorescence images of NOTCH1 expression in liver samples of NC and CCl4 group (n = 10 samples). (L) Western blotting analysis showing the NOTCH1, NICD1 and Hes1 expression in liver tissue isolated from NC or CCl4 group (n = 4 samples). (M, N) A dose-dependent rise in NOTCH1 gene expression levels and protein expression was detected in human THLE2 cells following 10 h of DMN incubation (10 µM, 20 µM, and 40 µM) (n = 10 samples). (O) Representative immunofluorescence images of NOTCH1 and HNF4A co-expression in the indicated groups (magnification, 400×, n = 10 samples). Data are presented as mean ± SEM. The associated experiments were performed independently at least three times. P < 0.05 indicates statistical significance
Fig. 3
Fig. 3
Hepatocyte-specific NOTCH1 knockout ameliorates hepatocellular inflammation injury in CCl4-treated mice. (A) Schematic of experimental procedures examining the effects of hepatocyte-specific NOTCH1 knockout (NOTCH1CKO) on CCl4-treated mice; NOTCH1f/f group served as the control. (B, C) Western blot and quantification of NOTCH1, NICD1 and Hes1 expression in the isolated liver samples of control and CCl4-treated mice (n = 4 mice per group). (D) Representative immunofluorescence images of NOTCH1 and HNF4A expression in liver samples of indicated groups (magnification, 100×, n = 10 samples). Records of body weight (E), food intake, water intake, liver coefficience, liver-to-spleen ratio (F), serum AST, ALT, AKP & GGT contents (G), serum pro-inflammatory cytokines TNF-α, IL-6, IL-18, CCL2, and IL-1β levels (H) in Control/NOTCH1f/f, Control/NOTCH1CKO, CCl4/NOTCH1f/f, and CCl4/NOTCH1CKO group (n = 10 mice per group). (I) Representative liver histological analysis detected by H&E staining and Masson staining showing the hepatic pathological injury in the indicated groups (magnification, 100×, n = 5 mice per group). (J) Representative immunofluorescence images showing the Hes1 and F4/80 co-expression in liver sections of the indicated groups (magnification, 400×, n = 5 mice per group). Data are presented as mean ± SEM. The associated experiments were performed independently at least three times. P < 0.05 indicates statistical significance
Fig. 4
Fig. 4
Hepatocyte-specific NOTCH1 knockout ameliorates oxidative injury and ferroptosis in CCl4-treated mice. (A-C) Representative immunofluorescence images showing the DHE and COL1A1 levels and their quantitative analysis in liver sections of the indicated groups (magnification, 100×, n = 5 mice per group). (D) Records of hepatic MDA, iNOS, H2O2, NO, XO activity, XDH activity, XO/XDH ratio, and O2 levels in the indicated groups (n = 10 mice per group). (E-G) Representative immunofluorescence images showing the 4-HNE and α-SMA levels and their quantitative analysis in liver sections of the indicated groups (magnification, 100×, n = 5 mice per group). (H) Records of hepatic SOD, GSH-Px, GST, T-AOC, CAT, GSH, and GSH/GSSG ration levels in the indicated groups (n = 10 mice per group). (I-K) Representative immunofluorescence images showing the SOD and GPX4 levels and their quantitative analysis in liver sections of the indicated groups (magnification, 100×, n = 5 mice per group). (L) Western blotting analysis showing the GPX4, SLC7A11 and ACSL4 protein expression in the indicated groups (n = 10 mice per group). (M) Records of iron contents in liver samples from experimental groups (n = 10 mice per group). Data are presented as mean ± SEM. The associated experiments were performed independently at least three times. P < 0.05 indicates statistical significance
Fig. 5
Fig. 5
Hepatocyte-specific NOTCH1 overexpression promotes hepatocellular inflammation injury in CCl4-treated mice. (A, B) Schematic of experimental procedures and quantitative analysis examining the effects of hepatocyte-specific NOTCH1 overexpression (HTG) using AAV-TBG-Cre-injected RosaNOTCH1 mice on CCl4-treated mice; AAV-TBG-Blank-injected RosaNOTCH1 mice (NTG) served as the control (n = 4 mice per group). (C) Western blotting analysis showing the NICD1 and Hes1 expression in CCl4/NTG and CCl4/HTG groups (n = 4 mice per group). (D) Representative immunofluorescence images of NOTCH1 and HNF4A expression in liver samples of indicated groups (magnification, 100×, n = 10 samples). Records of body weight, food intake, water intake, liver coefficience, liver-to-spleen ratio (E), serum AST, ALT, AKP & GGT contents (F), serum pro-inflammatory cytokines TNF-α, IL-6, IL-18, CCL2, and IL-1β levels (G) in CCl4/NTG and CCl4/HTG groups (n = 10 mice per group). (H) Representative liver histological analysis detected by H&E staining and Masson staining showing the hepatic pathological injury in the indicated groups (magnification, 100×, n = 5 mice per group). (I) Representative immunofluorescence images of Hes1 and F4/80 expression in liver samples of indicated groups (magnification, 100×, n = 10 samples). Data are presented as mean ± SEM. The associated experiments were performed independently at least three times. P < 0.05 indicates statistical significance
Fig. 6
Fig. 6
Hepatocyte-specific NOTCH1 overexpression facilitates oxidative injury and ferroptosis in CCl4-treated mice. (A-C) Representative immunofluorescence images showing the DHE and COL1A1 levels and their quantitative analysis in liver sections of the indicated groups (magnification, 100×, n = 5 mice per group). (D) Records of hepatic MDA, iNOS, H2O2, NO, XO activity, XDH activity, XO/XDH ratio, and O2 levels in the indicated groups (n = 10 mice per group). (E-G) Representative immunofluorescence images showing the 4-HNE and α-SMA levels and their quantitative analysis in liver sections of the indicated groups (magnification, 100×, n = 5 mice per group). (H) Records of hepatic SOD, GSH-Px, GST, T-AOC, CAT, GSH, and GSH/GSSG ration levels in the indicated groups (n = 10 mice per group). (I-K) Representative immunofluorescence images showing the SOD and GPX4 levels and their quantitative analysis in liver sections of the indicated groups (magnification, 100×, n = 5 mice per group). (L) Records of iron contents in liver samples from experimental groups (n = 10 mice per group). (M) Western blotting analysis showing the GPX4, SLC7A11 and ACSL4 protein expression in the indicated groups (n = 10 mice per group). Data are presented as mean ± SEM. The associated experiments were performed independently at least three times. P < 0.05 indicates statistical significance
Fig. 7
Fig. 7
NOTCH1 interacts with and recruits KEAP1 in hepatocytes, leading to NRF2 polyubiquitination degradation under CCl4 challenge. (A) THLE2 cells after transfection with Flag-NOTCH1 or the empty Vector were incubated with CCl4 for 24 h simultaneously in the presence of the protein synthesis inhibitor cycloheximide (CHX; 50 µg/ml) for the indicated times (0 h, 3 h, 6 h, 9 h). Relative protein expression levels for NRF2 in transfected THLE2 cells after time-course treatment were quantified (n = 4 per group). (B) Immunoblotting detection of Flag-NOTCH1 transfected THLE2 cells with/without CCl4 (24 h), MG132 (20 µM, 12 h) and CHO (20 µM, 12 h) treatment (n = 4 per group). (C) Left, the human THLE2 cells were transfected with the indicated plasmids. Anti-Nrf2 immunoprecipitates were analyzed by immunoblotting with anti-Ub antibody for the examination of ubiquitin-conjugated Nrf2. Right, the human THLE2 cells were transfected with the indicated plasmids. Anti-K48-Ub immunoprecipitates were analyzed by immunoblotting with anti-Ub antibody for the examination of ubiquitin-conjugated Nrf2. (D) The human THLE2 cells transfected with AdNOTCH1 or AdGFP were incubated with CCl4 for 24 h, and were then collected for qPCR analysis of NOTCH1 and KEAP1 (n = 5 per group). (E) Western blot analysis for NOTCH1 and KEAP1 protein expression levels in 24 h of CCl4-treated THLE2 cells with or without AdNOTCH1 transfection (n = 4 per group). (F) Immunoprecipitation and western blot analysis indicating the binding of KEAP1 to NOTCH1 in human THLE2 cells transfected with Flag-NOTCH1 and HA-tagged KEAP1 (HA-KEAP1) under CCl4 exposure. (G) Immunoprecipitation and immunoblotting assay showing the binding of KEAP1 to NOTCH1 in the liver samples of CCl4-treated mice; the IgG was served as a control. (H) Representative immunoblotting bands for GST precipitation showing NOTCH1-KEAP1 direct binding by treating purified NOTCH1-His with purified KEAP1-HA-GST or by treating KEAP1-His with purified NOTCH1-HA-GST in THLE2 cells. (I) Representative IF images showing NOTCH1 (green) and KEAP1 (red) in THLE2 cells challenged with/without CCl4 for 24 h (n = 5 independent biological replicates with 8 images per group). (J) Molecular docking analysis between NOTCH1 and KEAP1 protein. (K) Representative western blot of KEAP1 and NRF2 in THLE2 cells transfected with varying amounts of Flag-NOTCH1 with or without CCl4 incubation for 24 h. (L) Luciferase assay of the fluorescence intensity of THLE2 cells transfected with increasing counts of Flag-NOTCH1 plasmids in response to HG treatment for 24 h (n = 6 per group). (M) Western blot results for KEAP1 and NRF2 in the isolated hepatocytes from the shown groups (n = 4 per group). (N) Schematic indicating full-length and truncated NOTCH1 (upper, left) and KEAP1 (upper, right) with representative Co-IP results (bottom) for the mapping analysis of the domains responsible for the NOTCH1-KEAP1 interaction in human THLE2 cells. (O) Western blots of NICD1, KEAP1, NRF2, GPX4, and p-NF-κB in human THLE2 cells transfected with AdGFP, AdNOTCH1 (WT) or the ∆ANK NOTCH1/NICD1 variant at 24 h after CCl4 treatment (n = 3 per group). (P) DCF-DA staining, DHE staining, and Mito-SOX staining, and (Q) quantification for ROS production by respective staining were performed in human THLE2 cells transfected with AdGFP, AdNOTCH1 (WT) or the ∆ANK NOTCH1/NICD1 variant in response to CCl4 treatment for 24 h. (R) Lipid peroxidation was examined by C11-BODIPY in human THLE2 cells with AdGFP, AdNOTCH1 (WT) or the ∆ANK NOTCH1/NICD1 variant under CCl4 treatment for 24 h; red fluorescence represents the reduction form, while green fluorescence represents the oxidized form. (S) Mean intensity for the ratio of the oxidized form to reduced form was quantified related to C11-BODIPY staining (n = 5 per group). (T) Mito-Tracker was used to examine the mitochondrial structure changes of THLE2 cells transfected with AdGFP, AdNOTCH1 (WT) or the ∆ANK NOTCH1/NICD1 variant under CCl4 treatment for 24 h, and the mean mitochondrial size was then quantified (n = 6 per group). (U) Measurements for MDA levels, GSH contents, GSH/GSSG ratio, Fe2+ levels and ATP levels in 24 h of CCl4-treated THLE2 cells with AdGFP, AdNOTCH1 (WT) or the ∆ANK NOTCH1/NICD1 variant transfection (n = 6 per group). (V) qPCR analysis for the mRNA expression levels of genes involved in oxidative stress and ferroptosis as shown in THLE2 cells transfected with AdGFP, AdNOTCH1 (WT) or the ∆ANK NOTCH1/NICD1 variant after CCl4 incubation for 24 h (n = 4 in each group). (W) The mRNA expression levels of inflammatory genes were evaluated by qPCR in 24 h CCl4-incubated THLE2 cells transfected with AdGFP, AdNOTCH1 (WT) or the ∆ANK NOTCH1/NICD1 variant (n = 4 in each group). Data are presented as mean ± SEM. P < 0.05 indicates statistical significance. Two-tailed unpaired t-test was used to determine the p-values in (A), (E) and (F); Statistical comparisons in (L), (M), (O), (Q), (S) to (W) were performed using one-way ANOVA with a Tukey post-hoc analysis; the results in (C), (G) to (I), (K), and (N) were obtained from three independent experiments
Fig. 8
Fig. 8
Mutational NOTCH1 (△ANK) cannot effectively promotes CCl4-induced liver injury. (A) Schematic diagram of adeno-associated virus (serotype 8)-TBG-Cre (AAV-TBG-Cre)-mediated NOTCH1 restoration (GOF) or NOTCH1 (△ANK) restoration (△GOF) in liver of CCl4-fed NOTCH1CKO mice. The AAV-TBG-Blank was used as control (Control). (B, C) Western blotting analysis showing the NOTCH1, NOTCH1(△ANK), and Hes1 expression in the indicated mice groups (n = 5 mice per group). (D-G) Records of body weight, food intake, water intake, liver coefficience, liver-to-spleen ratio, serum AST, ALT, AKP, GGT, pro-inflammatory cytokines TNF-α, IL-6, IL-18, CCL2, and IL-1β levels in CCl4/Control, CCl4/GOF and CCl4/△GOF groups (n = 10 mice per group). (H) Representative liver histological analysis detected by H&E staining and Masson staining showing the hepatic pathological injury in the indicated groups (magnification, 100×, n = 5 mice per group). (I) Representative immunofluorescence images of Hes1 and F4/80 expression in liver samples of indicated groups (magnification, 100×, n = 10 samples). Data are presented as mean ± SEM. The associated experiments were performed independently at least three times. P < 0.05 indicates statistical significance
Fig. 9
Fig. 9
NOTCH1 promotes progression of liver inflammation-associated HCC. (A) Results for NOTCH1 mRNA expression levels of adjacent tissue and 12 individual paired HCC human patients tumor samples (n = 12 samples per group). Relative mRNA expression (B) and western blotting analysis (C, D) of NOTCH1 in 12 individual paired HCC human patients tumor samples and normal samples (n = 12 samples per group). (E) Representative immunofluorescence images showing the NRF2 and NOTCH1 co-expression in liver samples of human HCC patients (n = 6 samples per group; N, normal; T, tumor). (F) Western blotting analysis showing the NOTCH1, KEAP1, and NRF2 protein expression in livers of HCC mouse models (n = 12 samples per group). (G) Scheme for the experimental design on DEN-injected and CCl4-administrated HCC mouse models with hepatocyte-specific NOTCH1 knockout or hepatocyte-specific NOTCH1 overexpression. At the age of 7 days, NOTCH1f/f, NOTCH1CKO, and RosaNOTCH1 mice were injected with a single dose of DEN. Starting at 4 weeks of age, mice were treated with CCl4 for an additional 16 weeks. (H-J) Records of body weight, food intake, water intake, liver coefficience, liver-to-spleen ratio, serum AST, ALT, AKP, GGT, pro-inflammatory cytokines TNF-α, IL-6, IL-18, CCL2, and IL-1β levels in DEN-CCl4/NOTCH1f/f, DEN-CCl4/NOTCH1CKO, DEN-CCl4/NTG and DEN-CCl4/HTG groups (n = 10 mice per group). (K) Representative liver histological analysis detected by H&E staining showing the hepatic pathological injury in the indicated groups (magnification, 100×, n = 5 mice per group). (L) Representative immunofluorescence images of α-SMA and F4/80 co-expression in liver samples of indicated groups (magnification, 100×, n = 10 samples). (M) Measurement of tumor nodules on liver and corresponding liver tumor size (n = 10 samples). (N) Representative immunofluorescence images of KI67 and NOTCH1 co-expression in liver samples of indicated groups (magnification, 100×, n = 10 samples). Data are presented as mean ± SEM. The associated experiments were performed independently at least three times. P < 0.05 indicates statistical significance
Fig. 10
Fig. 10
Schematic diagram of NOTCH1 regulating KEAP1/NRF2 signaling in chronic liver injury and HCC progression. Stress challenges (such as TAA, CCl4, DMN, and DEN) cause NOTCH1(NICD1) signaling to be abnormally overexpressed. By directly interacting with and recruiting KEAP1, NICD1 promotes hepatocyte KEAP1 expression levels. Elevated KEAP1 causes NRF2 ubiquitination and facilitates NRF2 degradation, which lowers the transcription of protective genes such GCLC, HO-1, NQO1, and GPX4. Hepatocyte ferroptosis and excessive ROS generation are caused by this biological process, which ultimately results in the pathological development of hepatocellular damage. Notably, gene therapy that targets NOTCH1, specifically its NICD1 deletion, can disrupt its ability to bind and recruit KEAP1, improving the stability and expression of the NRF2 protein and its downstream protective signaling pathway, thereby suppressing chronic liver injury and the progression of HCC that is linked to it

Similar articles

References

    1. Devarbhavi H, Asrani SK, Arab JP, Nartey YA, Pose E, Kamath PS. Global burden of liver disease: 2023 update. J Hepatol. 2023;79(2):516–37. - PubMed
    1. Alberts CJ, Clifford GM, Georges D, Negro F, Lesi OA, Hutin YJ, de Martel C. Worldwide prevalence of hepatitis B virus and hepatitis C virus among patients with cirrhosis at country, region, and global levels: a systematic review. Lancet Gastroenterol Hepatol. 2022;7(8):724–35. - PMC - PubMed
    1. Hammerich L, Tacke F. Hepatic inflammatory responses in liver fibrosis. Nat Reviews Gastroenterol Hepatol. 2023;20(10):633–46. - PubMed
    1. Gálvez NM, Bohmwald K, Pacheco GA, Andrade CA, Carreño LJ, Kalergis AM. Type I natural killer T cells as key regulators of the immune response to infectious diseases. Clin Microbiol Rev. 2021;34(2):10–1128. - PMC - PubMed
    1. Xu M, Zhao J, Zhu L, Ge C, Sun Y, Wang R, Shi S. Targeting PYK2 with heterobifunctional T6BP helps mitigate MASLD and MASH-HCC progression. J Hepatol. 2025;82(2):277–300. - PubMed

MeSH terms