. 2025 Aug;169(8):e70169.
doi: 10.1111/jnc.70169.

Phosphoinositide- and Collybistin-Dependent Synaptic Clustering of Gephyrin

Affiliations

Phosphoinositide- and Collybistin-Dependent Synaptic Clustering of Gephyrin

Nele Burdina et al. J Neurochem. 2025 Aug.

Abstract

Gephyrin is the main scaffolding protein at inhibitory synapses, clustering glycine and GABAA receptors. At specific GABAergic synapses, the nucleotide exchange factor collybistin recruits gephyrin to the postsynaptic membrane via interaction with phosphoinositides. However, the molecular mechanisms underlying the formation, maintenance, and regulation of collybistin-dependent gephyrin clusters remain poorly understood. This study sheds light on the molecular mechanism of gephyrin cluster formation on the basis of gephyrin self-oligomerization induced by collybistin, leading to the formation of a high-molecular weight (> 5 MDa) gephyrin-collybistin complex, which is regulated in two ways: First, plasma-membrane phosphoinositides promote complex formation, demonstrating their critical role in membrane targeting and stabilization of gephyrin-collybistin clusters at postsynaptic sites. Second, gephyrin phosphorylation at Ser325 abolishes complex formation with collybistin, thus impairing collybistin-dependent gephyrin clustering at GABAergic synapses. Collectively, our data demonstrate a molecular mechanism for synaptic clustering of gephyrin, which involves collybistin- and phosphoinositide-dependent formation of high-molecular weight gephyrin oligomers.

Keywords: GABA receptors; collybistin; gephyrin; inhibitory synapse; phosphoinositides; synaptic clustering.


Conflict of interest statement

The authors declare no conflicts of interest.

Figures

FIGURE 1
FIGURE 1
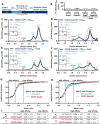
High‐molecular weight gephyrin‐CB2SH3‐ complex formation is dependent on gephyrin self‐oligomerization and promoted by Folch lipids. (A) Domain structure of the used gephyrin (Geph) variants with the CB binding motif highlighted (Harvey et al. 2004). (B) Domain structure of CB2 with and without SH3 domain. The gephyrin binding motif is highlighted (Grosskreutz et al. ; Tyagarajan, Ghosh, Harvey, and Fritschy 2011). (C–H) Representative SEC elution profiles of gephyrin variants mixed with CB2SH3‐ at equimolar ratios (dark blue line), alone or in the presence of Folch. Single gephyrin (dashed line, light blue) and CB2SH3‐ (dashed line, orange), with or without Folch, serve as a reference within each graph. The MWs of the single proteins as well as the formed complexes, determined according to the standard protein calibration curve, are indicated. Insets depict SDS‐PAGE analysis of peak 1 (P1), peak 2 (P2), and peak 3 (P3) of the respective gephyrin‐CB2SH3‐ interaction runs. Numbers above and below the representative SDS‐PAGE image represent the mean relative band intensity ± SD [%] of gephyrin (light blue) and CB2SH3‐ (orange), respectively, between P1, P2, and P3 (n = 3 from three independently purified protein batches). (I) Quantification of P1 absorption at 280 nm expressed as mean ± SD (n = 3 from three independently purified protein batches). ddGephT and GephE are shown as a control depicting an absent gephyrin‐CB2SH3‐ complex formation. The different oligomeric states of full‐length WT‐Geph were analyzed by one‐way ANOVA (F(5,12) = 37.89, p < 0.0001, Bonferroni post hoc test: GephT vs. GephHO p = 0.0008 (***); GephT vs. GephT+Folch p = 0.0299 (*); GephT vs. GephHO+Folch p < 0.0001 (****); GephHO vs. GephT+Folch p = 0.7542 (ns); GephHO vs. GephHO+Folch p = 0.0151 (*); GephT+Folch vs. GephHO + Folch p = 0.0004 (***)). (J, K) Proposed model for the formation of the > 5 MDa gephyrin‐CB2SH3‐ complex via gephyrin E‐domain dimerization induced by CB2SH3‐ and stabilized by Folch lipids comparing (J) GephT and (K) GephHO (created with BioRender.com).
FIGURE 2
FIGURE 2
Plasma‐membrane‐resident PIPs stabilize the high‐molecular weight gephyrin‐CB2SH3‐ complex. (A) Representative SEC elution profiles of GephHO mixed with CB2SH3‐ at equimolar ratios, in the presence of the respective POPC‐/PIP‐lipid DDM micelles (dark blue line). Single GephHO (dashed line, light blue) and CB2SH3‐ (dashed line, orange) together with the respective POPC‐/PIP‐lipid DDM micelles serve as a reference within each graph. Insets depicting SDS‐PAGE analysis of peak 1 (P1), peak 2 (P2), and peak 3 (P3) of the respective GephHO‐CB2SH3‐ interaction run. Numbers above and below the representative SDS‐PAGE image represent the mean relative band intensity ± SD [%] of GephHO (light blue) and CB2SH3‐ (orange), respectively, between P1, P2, and P3 (n = 3 from three independently purified protein batches). Depiction of the used PIP created with BioRender.com. (B) Quantification of P1 absorption at 280 nm expressed as mean ± SD (n = 3 from three independently purified protein batches). PIP treated conditions were compared to the POPC control condition, revealing that P1 absorption is significantly increased for plasma‐membrane‐resident PIPs (1way ANOVA F(6,14) = 16.64, p < 0.0001, Dunnett's post hoc test: PI(4)P p = 0.9998 (ns); PI(3)P p = 0.9980 (ns); PI(3,5)P2 p = 0.8317 (ns); PI(4,5)P2 p = 0.0306 (*); PI(3,4)P2 p = 0.0003 (***); PI(3,4,5)P3 p = 0.0001 (****)). (C) Molecular structure of a PIP with the possible phosphorylation sites at the inositol ring highlighted in red (created with ChemDraw).
FIGURE 3
FIGURE 3
S325D‐Geph does not form a complex with CB2SH3‐, whereas the receptor binding ability is improved. (A) Domain structure of the phosphomimicking mutant T324D‐Geph and S325D‐Geph with the phosphorylation sites highlighted in red. (B–F) SEC interaction studies of the different oligomeric states of S325D‐Geph mixed with CB2SH3‐ at equimolar ratios. (B) Quantification of peak 1 (P1) absorption at 280 nm expressed as mean ± SD (n = 3 from three independently purified protein batches). One‐way ANOVA revealed no significant differences between conditions (F(3,8) = 1.379, p = 0.3175). (C–F) Representative SEC elution profiles of S325D‐Geph mixed with CB2SH3‐ (dark blue line), alone or in the presence of Folch. Single S325D‐Geph (dashed line, light blue) and CB2SH3‐ (dashed line, orange), with or without Folch, serve as a reference within each panel. The MWs of the single proteins, determined according to the standard protein calibration curve, are indicated. Insets depict SDS‐PAGE analysis of peak 1 (P1), peak 2 (P2), and peak 3 (P3) of the S325D‐Geph–CB2SH3‐ interaction run. Numbers above and below the representative SDS‐PAGE image represent the mean relative band intensity ± SD [%] of S325D‐Geph (light blue) and CB2SH3‐ (orange), respectively, between P1, P2, and P3 (n = 3 from three independently purified protein batches). (G, H) Representative ITC binding isotherms of the GlyR β‐loop titrated into the respective oligomeric state of WT‐Geph or S325D‐Geph. The binding data points were fitted using a two‐side model (line) with the high and low affinity binding sites highlighted. (I, J) Binding parameters derived from the ITC experiments, including K D (μM) and N (molar ratio). Results are expressed as mean ± SD (n = 4 from three independently purified protein batches) and were analyzed using unpaired, two‐tailed Student's t‐test. For the high affinity binding site, the K D value was significantly decreased for both oligomeric states of S325D‐Geph compared to WT‐Geph (GephT: p = 0.0113 (*); GephHO: p = 0.0110 (*)). All other parameters were not significantly altered (ns = p ≥ 0.05).
FIGURE 4
FIGURE 4
S325D‐ and S325A‐Geph do not form submembranous microclusters upon CB2SH3‐ co‐expression in HEK GPHN−/− cells. (A) Representative confocal images of HEK GPHN−/− cells expressing GFP‐tagged WT‐Geph, S325D‐Geph, or S325A‐Geph alone (B) or together with myc‐tagged CB2SH3‐ (scale bars = 10 μm). Insets show zoomed‐in views of protein clusters, with white boxes indicating the regions displayed (scale bars = 2 μm). CB2SH3‐ induces the formation of WT‐Geph microclusters at the plasma membrane. This microcluster formation is absent in the case of S325D‐ and S325A‐Geph. (C, D) Quantitative analysis of GFP‐Geph clusters with individual data points and mean ± SEM displayed in the figures (n = 13–15 images from three independent transfections). (C) Quantification of the GFP‐tagged Geph cluster number per 100 μm2 analyzed with a Kruskal–Wallis followed by Dunn's post hoc test (total: H = 53.67; WT vs. WT + CB: p < 0.0001 (****); WT vs. S325A + CB: p = 0.0137 (*); WT + CB vs. S325D: p < 0.0001 (****); WT + CB vs. S325D + CB: p = 0.0030 (**); WT + CB vs. S325A: p = 0.0002 (***); S325D vs. S325A + CB: p = 0.0040 (**)); all other comparisons were not significant (ns = p ≥ 0.05). (D) Quantification of the mean GFP‐Geph cluster size per image analyzed with a Kruskal–Wallis followed by Dunn's post hoc test (total: H = 37.12; WT vs. WT + CB: p < 0.0001 (****); WT + CB vs. S325D: p < 0.0001 (****); WT + CB vs. S325D + CB: p = 0.0038 (**); WT + CB vs. S325A: p = 0.0070 (**); WT + CB vs. S325A + CB: p = 0.0286 (*)); all other comparisons were not significant (ns = p ≥ 0.05).
FIGURE 5
FIGURE 5
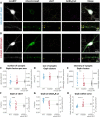
Impaired S325D‐Geph clustering at GABAergic synapses in murine hippocampal neurons. Representative confocal images of hippocampal neurons expressing moxBFP‐IRES‐Flpo and mScarlet‐tagged (A) WT‐Geph or (B) S325D‐Geph. (C–H) Quantitative analysis of mScarlet‐tagged Geph clusters was performed using an automated image analysis with the individual data points, mean, confidence intervals, and standard deviation displayed in the figures (n = 30 cells per condition from four independent cultures). (C, D) Average number (per μm2) as well as average size (per cell) of synaptic clusters (vGAT‐positive and GABAARɣ2‐positive) is not different between both variants; Wilcoxon rank test p = 0.786 (ns) and p = 0.542 (ns), respectively. (E) The average fluorescence intensity of synaptic S325D‐Geph clusters (per cell) is significantly reduced compared to WT‐Geph; Wilcoxon rank test p = 0.002 (**). (F, G) The fractions of vGAT‐ and GABAARɣ2‐positive clusters are significantly reduced in case of S325D‐Geph; Student's t test p = 0.0005 (***) and p = 4.1 × 10−10 (****), respectively. (H) Ratio of somatic/whole cell mean mScarlet‐Geph fluorescence intensity is significantly increased for S325D‐Geph compared to WT‐Geph; Student's t test p = 1.2 × 10−6 (****).
FIGURE 6
FIGURE 6
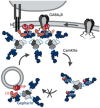
Proposed mechanism of gephyrin self‐oligomerization induced by CB at PIP‐containing postsynaptic membranes regulated via gephyrin phosphorylation. (A) Intracellularly, gephyrin trimers (GephT) with monomerized E‐domains bind to CB with a low affinity. Either gephyrin itself (Imam et al. 2022) or other interactors such as TC10 (Kilisch et al. 2020) activate CB, so that it specifically binds PI(3)P at early/sorting endosomes (Papadopoulos et al. 2017). Prolonged interaction with TC10 induces a phospholipid affinity switch of CB towards plasma‐membrane PIPs, resulting in the recruitment of the gephyrin‐CB complex towards the plasma membrane (Kilisch et al. 2020). (B) Interaction of CB with plasma‐membrane‐resident PIPs, PI(3,4,5)P3, PI(3,4)P2, and PI(4,5)P2, induces a conformational change within CB that promotes the interaction with the dimerized gephyrin E‐domain. Thereby, gephyrin E‐domain dimerization is stabilized, which leads to the formation of a postsynaptic gephyrin network. Additionally, because of an unknown mechanism, gephyrin associated with the plasma membrane adopts a higher oligomeric state (GephHO), which further promotes the complex formation with CB. PI(4,5)P2 bound to the cytosolic part of the GABAAR α‐subunits can additionally stabilize this gephyrin‐CB scaffold. (C) The CB and PIP induced gephyrin network can be regulated via phosphorylation of gephyrin Ser325 by CaMKIIα activation upon increased neuronal activity (Ogino et al. 2019). This phosphorylation impairs the complex formation with CB, thereby leading to the removal of gephyrin from gephyrin‐CB clusters at GABAergic synapses as well as an impaired transport via CB‐PI(3)P containing endosomes. Figure was created with BioRender.com.

Similar articles

References

    1. Bai, G. , Wang Y., and Zhang M.. 2021. “Gephyrin‐Mediated Formation of Inhibitory Postsynaptic Density Sheet via Phase Separation.” Cell Research 31, no. 3: 312–325. 10.1038/s41422-020-00433-1. - DOI - PMC - PubMed
    1. Bedet, C. , Bruusgaard J. C., Vergo S., et al. 2006. “Regulation of Gephyrin Assembly and Glycine Receptor Synaptic Stability.” Journal of Biological Chemistry 281, no. 40: 30046. 10.1074/jbc.M602155200. - DOI - PubMed
    1. Belaidi, A. A. , and Schwarz G.. 2013. “Metal Insertion Into the Molybdenum Cofactor: Product‐Substrate Channelling Demonstrates the Functional Origin of Domain Fusion in Gephyrin.” Biochemical Journal 450: 149–157. 10.1042/BJ20121078. - DOI - PubMed
    1. Breitinger, U. , Weinländer K., Pechmann Y., et al. 2020. “A Proline‐Rich Motif in the Large Intracellular Loop of the Glycine Receptor α1 Subunit Interacts With the Pleckstrin Homology Domain of Collybistin.” Journal of Advanced Research 29: 95–106. 10.1016/j.jare.2020.09.009. - DOI - PMC - PubMed
    1. Chiou, T. T. , Bonhomme B., Jin H., et al. 2011. “Differential Regulation of the Postsynaptic Clustering of γ‐Aminobutyric Acid Type A (GABAA) Receptors by Collybistin Isoforms.” Journal of Biological Chemistry 286, no. 25: 22456–22468. 10.1074/jbc.M111.236190. - DOI - PMC - PubMed

LinkOut - more resources