

Value of serum uric acid in a risk prediction model for postmenopausal osteoporosis
- PMID: 40782147
- PMCID: PMC12414051
- DOI: 10.1007/s00404-025-08119-y
Value of serum uric acid in a risk prediction model for postmenopausal osteoporosis
Abstract
Objective: To investigate the potential role of serum uric acid (UA) in risk stratification for postmenopausal osteoporosis (PMOP) and to establish an accessible risk prediction model that can aid in early screening and diagnosis.
Methods: We retrospectively enrolled 295 postmenopausal women who underwent dual-energy X-ray absorptiometry (DXA) at Zhuhai Hospital affiliated with Jinan University from July 2021 to July 2023. Participants were divided into a PMOP group (T-score < -2.5; n = 125) and a control group (T-score ≥ -2.5; n = 170). Clinical and laboratory data were collected, including markers of inflammation, renal function, and uric acid levels. Univariable and multivariable logistic regression analyses identified independent risk factors for PMOP. A nomogram was constructed based on the final logistic regression model and evaluated for discrimination and calibration using receiver operating characteristic (ROC) curves, calibration curves, and the concordance index (C-index).
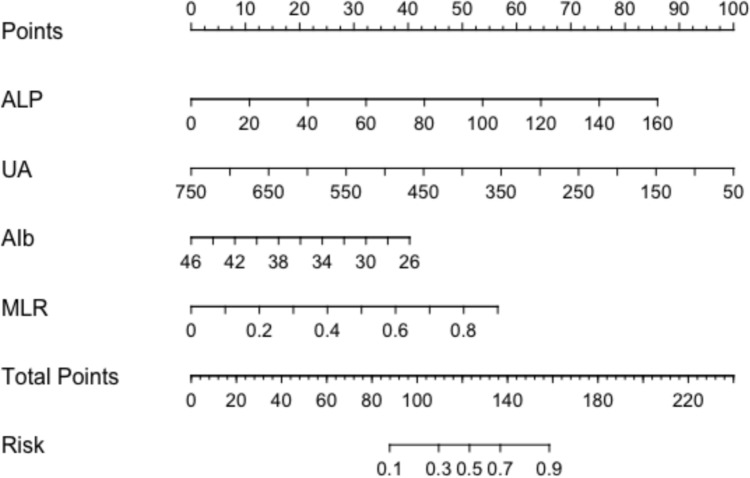
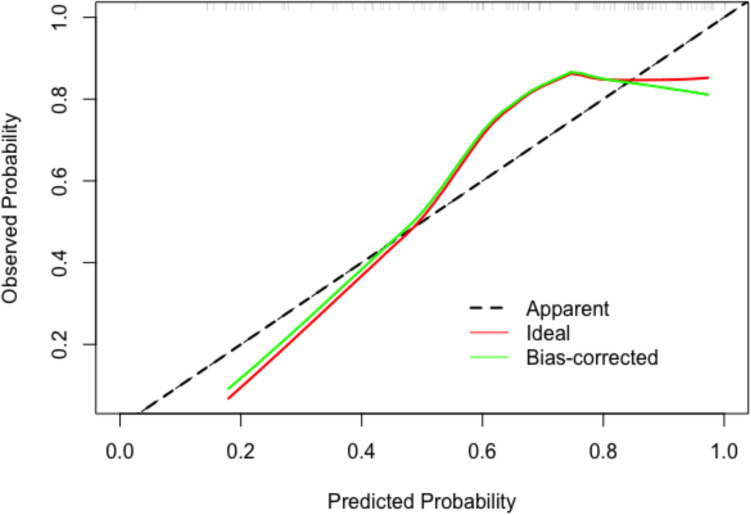
Results: The PMOP group exhibited significantly higher mean values of age, alkaline phosphatase (ALP), neutrophil count (NEU), monocyte count (MO), monocyte-to-lymphocyte ratio (MLR), and the systemic immune-inflammation index (SII), while demonstrating significantly lower lymphocyte counts (LYM), height, OSTA scores, and albumin (ALB). Serum UA values were slightly lower in the PMOP group than in the control group. Multivariable logistic regression yielded a prediction model incorporating ALB, ALP, MLR, and UA. The area under the ROC curve (AUC) for this model was 0.781 (95% CI: 0.682-0.879). The calibration curve aligned well with the ideal reference line, and the C-index was 0.779 (95% CI: 0.728-0.831).
Conclusion: Serum uric acid may have a contributory role in risk stratification for PMOP when combined with key clinical and laboratory markers. This nomogram-based model demonstrates moderate predictive performance; future large-scale multicenter prospective cohorts are warranted to validate these findings and to refine the model by accounting for potential confounding factors such as medication use, dietary intake, and lifestyle habits.
Keywords: Bone mineral density; Nomogram; Postmenopausal osteoporosis; Risk prediction model; Serum uric acid.
© 2025. The Author(s).
Conflict of interest statement
Declarations. Conflict of interest: The authors declare no competing interests. Ethical approval: The study protocol was reviewed and approved by the Ethics Committee of the Zhuhai Clinical Medical College, Jinan University. Informed consent was obtained from each participant before enrollment.
Figures
References
-
- Kha M, Kibria M, Ferdous J, Shihab H, Faisal S (2024) Unveiling the burden of osteoporosis: exploring the prevalence and risk factors among postmenopausal women in north central Bangladesh. Central Med College J 7(1):32–40. 10.3329/cemecj.v7i1.70940
-
- A. O. M, Mohankumar M (2024) A systematic review on osteoporosis prediction in postmenopausal women. In: 2024 1st international conference on trends in engineering systems and technologies (ICTEST). IEEE, pp 1–6. 10.1109/ICTEST60614.2024.10576193
-
- Hamza AF, Koay WJ, Álvarez V, Leahy A (2024) Prevalence of osteoporosis and indications for bone-treatment in older adults living with frailty enrolled in a local integrated care programme. Age Ageing 53(Supplement_4). 10.1093/ageing/afae178.348
MeSH terms
Substances
LinkOut - more resources
Full Text Sources
Research Materials
Miscellaneous
