. 2025 Aug 9;16(1):7342.
doi: 10.1038/s41467-025-62672-3.

Heat transfer in metallic nanometre-sized gaps

Affiliations

Heat transfer in metallic nanometre-sized gaps

Rubén López-Nebreda et al. Nat Commun. .

Abstract

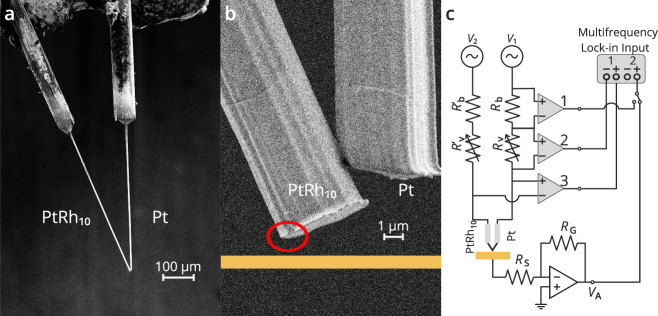
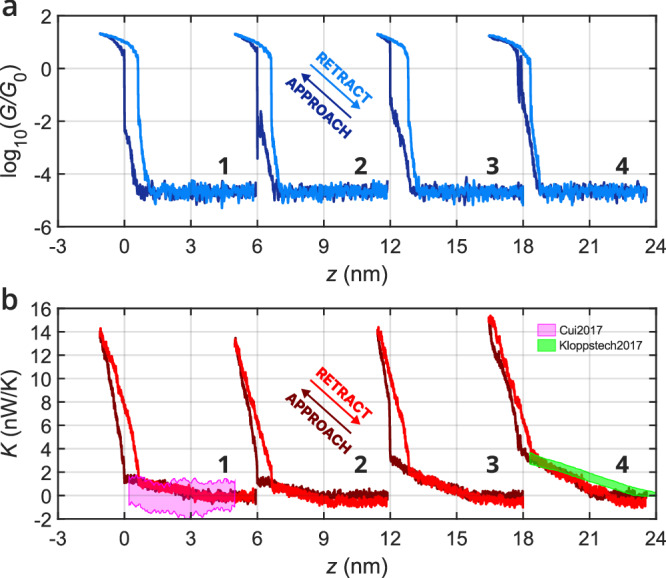
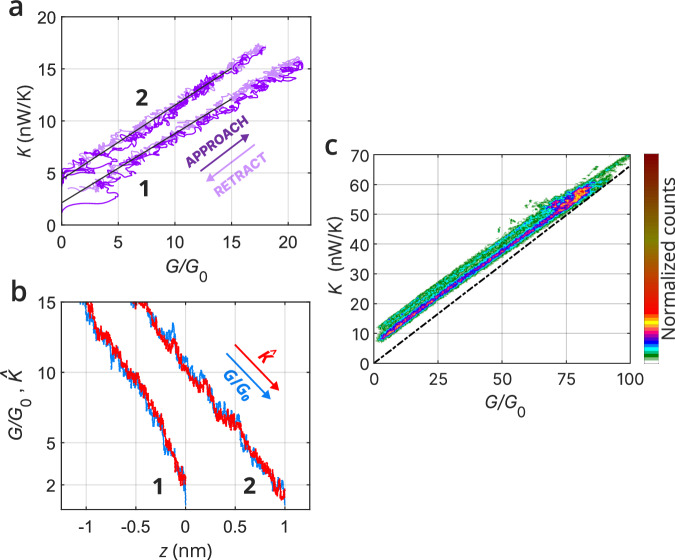
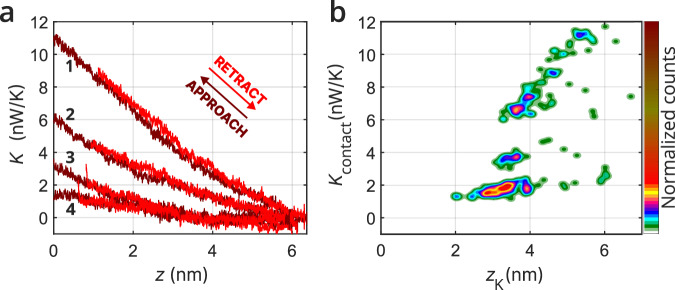
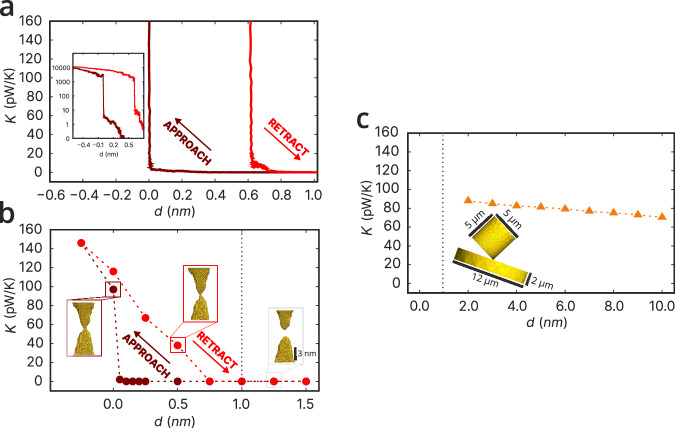
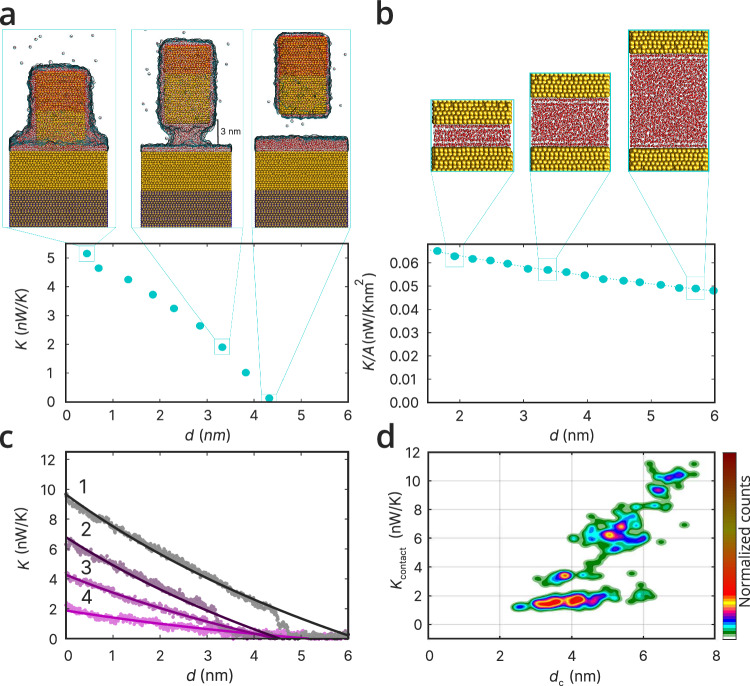
Heat transfer in nanoscale gaps is of key relevance for a variety of technologies. Recent experiments have reported contradictory results shedding doubts about the fundamental mechanisms for heat exchange when bodies are separated by nanometre-sized gaps. Here, we aim at resolving this controversy by measuring the thermal conductance of gold atomic-sized contacts with a custom-designed scanning tunnelling microscope that incorporates a novel thermal probe. This technique enables the measurement of thermal and electrical conductance in different transport regimes. When the electrodes are separated by a nanometre-sized gap, we observe thermal signals whose magnitude and gap size dependence cannot be explained with standard heat transfer mechanisms. With the help of non-equilibrium molecular dynamic simulations, we elucidate that these anomalous signals are due to the thermal conduction through water menisci that form between tip and sample under customary operation conditions. Our work resolves this fundamental puzzle and suggests avenues for the investigation of heat conduction in atomic and molecular junctions.


Conflict of interest statement

Competing interests: The authors declare no competing interests.

Figures

Fig. 1
Fig. 1. Experimental setup and measurement technique.
a SEM picture of the STM thermoelectric-resistive sensor consisting of two welded Wollaston wires of Pt (right-hand-side wire) and PtRh10 (left-hand-side wire), of approximately 5 µm in diameter and 500 µm in length. b Zoom of the welded junction, which acts as an STM tip. The orientation of the substrate with respect to the sensor in working conditions is indicated by the golden horizontal line, and the effective apex of the tip is indicated by the red ellipse. c Schematics of the multifrequency measuring system. The ac voltages applied to the probe are V1=Vheatfheat+Vbiasfbias/2 and V2=ZVheatfheat+Vbiasfbias/2, where fheat=31.123 kHz and fbias=51.987 kHz. Differential amplifier #1 measures the voltage drop at the calibrated resistor Rb to extract the heating current; differential amplifier #3 measures the voltage drop at the sensor; and resistor Rv is used via differential amplifier #2 to set a variable offset for the voltage drop at the sensor. Resistors Rb and Rv are used to balance the circuit, and VA measures the tip-substrate current.
Fig. 2
Fig. 2. Thermal conductance in the crossover between tunnelling and contact regime.
a, b show the tip-substrate electrical and thermal conductance vs tip displacement traces, G-z and K-z, respectively, both for approach and retraction to the sample after a clean region of the contact area. The shadowed areas in (b) represent the results reported in ref. . (green) and ref. (magenta). For representation purposes, traces are displaced in z by multiples of 6 nm.
Fig. 3
Fig. 3. Thermal conductance in the contact regime.
a shows K vs G for the traces #1 and #4 in Fig. 2a, b. b shows the normalised thermal conductance K^ superimposed to the electrical conductance. K^=KKG=0/sK, where sK is the slope of K vs G. c shows K vs G for large contacts, while the black dashed line represents the theoretical WF values.
Fig. 4
Fig. 4. Thermal conductance in the tunnelling regime.
a Portion of the K-z traces before the PMC for several different clean contacts, showing approach in brown and retract in red. All traces have been cut when the electrical conductance jumps to G0. b 2D histogram of the conductance at the PMC Kcontact vs the onset of the thermal conductance zK for 200 clean contacts.
Fig. 5
Fig. 5. Simulations of the heat conductance of clean contacts in the tunnelling regime.
a Computed electronic thermal conductance as a function of the tip-sample distance for two characteristic traces (approach and retract). The inset shows the same, but in a logarithmic scale. The thermal conductance was computed using the experimental results for the electrical conductance and the Wiedemann–Franz law with the average temperature of the electrodes (363 K). b Thermal conductance due to phonons computed with NEMD simulations. The two traces correspond to the approach and retract of the tip, and the insets show the contact geometries at different states. The scale bar is 3 nm long. c Radiative thermal conductance as a function of the gap size for the geometry shown in the inset with corresponding dimensions. The conductance was calculated within the framework of fluctuational electrodynamics. The temperatures used in all panels are Tt = 428 K and Ts = 298 K, for the tip and the sample, respectively.
Fig. 6
Fig. 6. Heat conductance simulations in the presence of a water meniscus.
a Thermal conductance as a function of the tip-sample distance for a water meniscus as computed from NEMD simulations. The upper panels show different snapshots of the evolution of the water meniscus. The gold tip has an area of 29.4 nm2, while temperatures used in the simulations are Tt=428 K and Ts=298 K, for the tip and the sample, respectively. b Computed thermal conductance per unit of area of extended gold-water-gold contacts as a function of the distance between the Au reservoirs. The symbols are the results of the NEMD simulations, and the dotted line to the fit with Eq. (2). The temperatures of the thermal baths were fixed to Tt=42 K and Ts=298 K. c Representative examples of the fits of the experimental traces for the conductance as a function of the tip-sample distance using Eq. (2) and the Ansatz for the meniscus’ cross section as a function of the tip-sample distance (see text). The colour lines are the experimental results and the black lines the fits. d 2D histogram of the conductance at PMC versus the breaking distance as obtained from the fit of 200 traces using the model described in the text.

Similar articles

References

    1. Mittapally, R., Majumder, A., Reddy, P. & Meyhofer, E. Near-field thermophotovoltaic energy conversion: progress and opportunities. Phys. Rev. Appl.19, 037002 (2023).
    1. De Wilde, Y. et al. Thermal radiation scanning tunnelling microscopy. Nat. Phys.444, 740–743 (2006). - PubMed
    1. Song, B., Fiorino, A., Meyhofer, E. & Reddy, P. Near-field radiative thermal transport: from theory to experiment. AIP Adv.5, 053503 (2015).
    1. Cuevas, J. C. & García-Vidal, F. J. Radiative heat transfer. ACS Photonics5, 3896–3915 (2018).
    1. Biehs, S. A. et al. Near-field radiative heat transfer in many-body systems. Rev. Mod. Phys.93, 025009 (2021).

LinkOut - more resources