. 2025 Aug 9;16(1):7367.
doi: 10.1038/s41467-025-62379-5.

Mitochondrial damage triggers the concerted degradation of negative regulators of neuronal autophagy

Affiliations

Mitochondrial damage triggers the concerted degradation of negative regulators of neuronal autophagy

Bishal Basak et al. Nat Commun. .

Abstract

Mutations that disrupt the clearance of damaged mitochondria via mitophagy are causative for neurological disorders including Parkinson's. Here, we identify a Mitophagic Stress Response (MitoSR) activated by mitochondrial damage in neurons and operating in parallel to canonical Pink1/Parkin-dependent mitophagy. Increasing levels of mitochondrial stress trigger a graded response that induces the concerted degradation of negative regulators of autophagy including Myotubularin-related phosphatase (MTMR)5, MTMR2 and Rubicon via the ubiquitin-proteasome pathway and selective proteolysis. MTMR5/MTMR2 inhibit autophagosome biogenesis; consistent with this, mitochondrial engulfment by autophagosomes is enhanced upon MTMR2 depletion. Rubicon inhibits lysosomal function, blocking later steps of neuronal autophagy; Rubicon depletion relieves this inhibition. Targeted depletion of both MTMR2 and Rubicon is sufficient to enhance mitophagy, promoting autophagosome biogenesis and facilitating mitophagosome-lysosome fusion. Together, these findings suggest that therapeutic activation of MitoSR to induce the selective degradation of negative regulators of autophagy may enhance mitochondrial quality control in stressed neurons.


Conflict of interest statement

Competing interests: The authors declare no competing interests.

Figures
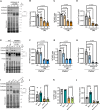
Fig. 1
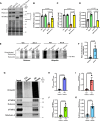
Fig. 1. Mitochondrial stress initiates the concerted degradation of MTMR5, MTMR2 and Rubicon, independent of Parkin activity or autophagic flux.
AD MTMR5, MTMR2, and Rubicon are degraded in response to increasing concentrations of Ant A. A Representative western blots from lysates of wild type (WT) murine embryonic cortical neurons treated with vehicle (EtOH), or with increasing concentrations of Ant A (3 nM, 15 nM or 30 nM) for 2 hrs. B MTMR5 band intensity normalized to total protein from WT neurons treated with EtOH or increasing concentrations of Ant A. C Ratio of intact MTMR2 band intensity normalized to total (intact + degraded) band intensities from WT neurons treated with EtOH or increasing concentrations of Ant A. D Rubicon band intensity normalized to total protein from WT neurons treated with EtOH or increasing concentrations of Ant A (AD: N = 4 experiments, One way ANOVA with Dunnett’s multiple comparison test). EH Concerted degradation of MTMR5, MTMR2, and Rubicon is also observed in cortical neurons from Parkin−/− mouse embryos. E Representative western blots from lysates of Parkin−/− murine embryonic cortical neurons treated with vehicle (EtOH), or with increasing concentrations of Ant A (3 nM, 15 nM or 30 nM) for 2 hrs. F MTMR5 band intensity normalized to total protein from Parkin−/− neurons treated with EtOH or increasing concentrations of Ant A. G Ratio of intact MTMR2 band intensity normalized to total (intact + degraded) band intensities from Parkin−/− neurons treated with EtOH or increasing concentrations of Ant A. H Rubicon band intensity normalized to total protein from Parkin−/− neurons treated with EtOH or increasing concentrations of Ant A (EH: N = 3 experiments, One way ANOVA with Dunnett’s multiple comparison test). IL Inhibition of autophagy does not block the degradation of MTMR5, MTMR2, or Rubicon in response to mitochondrial damage. I Representative western blots from lysates of WT cortical neuronal lysates treated with vehicle (DMSO) or 500 nM Bafilomycin A1 (Baf A1) for 1 hr followed by an additional treatment with vehicle (EtOH) or 15 nM Ant A for 2 hrs. J MTMR5 band intensity normalized to total protein from WT neurons treated with DMSO/Baf A1 and EtOH/Ant A. K Ratio of intact MTMR2 normalized to total (intact + degraded) band intensities from WT neurons treated with DMSO/Baf A1 and EtOH/Ant A. L Rubicon band intensity normalized to total protein from WT neurons treated with DMSO/Baf A1 and EtOH/Ant A (IL: N = 4 experiments, J, L: one way ANOVA with Sidak’s multiple comparison test, K: Kruskal–Wallis test). Error bars indicate SEM. Source data are provided as a Source Data file.
Fig. 2
Fig. 2. MTMR5, MTMR2 and Rubicon are ubiquitinated and degraded by the proteasome upon acute mitochondrial damage.
AD Proteasomal inhibition blocks the concerted degradation of MTMR5, MTMR2, and Rubicon. A Representative western blots from lysates of WT murine embryonic cortical neurons treated with vehicle (EtOH) or 10 μM MG132 for 1 hr followed by an additional treatment with vehicle (EtOH) or 15 nM Ant A for 2 hrs. B MTMR5 band intensity normalized to total protein from WT neurons treated with EtOH/MG132 and EtOH/Ant A. C Ratio of intact MTMR2 normalized to total (intact + degraded) band intensities from WT neurons treated with EtOH/MG132 and EtOH/Ant A. D Rubicon band intensity normalized to total protein from WT neurons treated with EtOH/MG132 and EtOH/Ant A (AD: N = 3 experiments, one way ANOVA with Sidak’s multiple comparison test). E, F Mitochondrial damage accelerates ubiquitination of Rubicon in neurons. E Representative western blot from wild type cortical neuronal lysates treated with vehicle (EtOH) or 30 nM Ant A for 2 hrs and immunoprecipitated with Rubicon antibody or control Rabbit IgG. F Quantification of the ratio of ubiquitinated to total Rubicon upon immunoprecipitation of Rubicon in neurons treated with EtOH or Ant A (N = 4 experiments, two-tailed unpaired t test). GK Negative regulators of autophagy are ubiquitinated in response to mitochondrial stress. G Representative western blot of ubiquitin enrichment assay from lysates of WT murine embryonic cortical neurons. Neurons were treated with 10 μM MG132 for 1 hr followed by an additional treatment with 15 nM Ant A for another 2 hrs (Ub beads = Ubiquitination affinity beads). H Ub enrichment following pull-down with Ub beads or control beads, normalized to intensity in the input lane. I MTMR5 enrichment following pull-down with Ub beads or control beads, normalized to intensity in the input lane. J MTMR2 enrichment following pull-down with Ub beads or control beads, normalized to its intensity in the input lane. K Rubicon enrichment after pull-down with Ub beads or control beads, normalized to its intensity in the input lane (GK: N = 3 experiments, two-tailed unpaired t test). Error bars indicate SEM. Source data are provided as a Source Data file.
Fig. 3
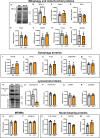
Fig. 3. Mitochondrial damage does not impact the levels of majority of proteins congruent to mitophagy in neurons.
A, B Mitochondrial damage initiates degradation of MFN-2 as an outcome of Pink1/Parkin-mediated mitophagy. A Representative western blot of wild-type cortical neurons treated with vehicle (EtOH) or 30 nM Ant A for 2 hrs and probed for MFN-2. B Quantification of MFN-2 levels in neurons treated with vehicle (EtOH) or Ant A. CH Mitochondrial damage does not influence the levels of additional mitophagy-associated proteins and mitochondrial proteins. Quantification of levels of other mitophagy proteins (C Parkin, D TBK1, E RAB7, F BNIP3) and mitochondrial proteins (G COX2, H Mitofilin) in neurons treated with vehicle (EtOH) or 30 nM Ant A for 2 hrs. IM Levels of autophagy-promoting proteins are unaltered during mitochondrial damage. Quantification of levels of autophagy-associated proteins (I VPS34, J ATG5, K ATG7, L GABARAP, M LC3) in neurons treated with vehicle (EtOH) or 30 nM Ant A for 2 hrs. N, O Mitochondrial damage initiates degradation of Cathepsin B, presumably because of increased lysosomal function. N Representative western blot of wild type cortical neurons treated with vehicle (EtOH) or 30 nM Ant A for 2 hrs and probed for Cathepsin B and ATP6V1E1. O Quantification of Cathepsin B levels in neurons treated with vehicle (EtOH) or Ant A. PR Lysosomal membrane proteins are unaffected during mitochondrial stress. Quantification of levels of lysosomal membrane proteins (P ATP6V1E1, Q LAMP1, R SCARB2) in neurons treated with vehicle (EtOH) or 30 nM Ant A for 2 hrs. S, T Mitochondrial damage does not target other proteins of the MTMR family. Quantification of levels of two members of the MTMR family (S MTM1, T MTMR14) in neurons treated with vehicle (EtOH) or 30 nM Ant A for 2 hrs. UW House-keeping proteins are unaltered upon mitochondrial damage in neurons. Quantification of levels of house-keeping proteins (U α/β-Tubulin, V GAPDH, W Actin) in neurons treated with vehicle (EtOH) or 30 nM Ant A for 2 hrs. (All panels: for statistical analysis, two-tailed unpaired t tests were performed for all proteins except for COX2, BNIP-3 and TBK-1. Mann–Whitney test was performed for these three proteins because the data did not show a normal distribution. Error bars indicate SEM). Source data are provided as a Source Data file.
Fig. 4
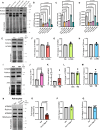
Fig. 4. Activation of the MitoSR is specific to mitochondrial damage in neurons and targets negative regulators of autophagy.
AD Concerted degradation of MTMR5, MTMR2, and Rubicon is mediated by diverse triggers of mitophagy. A Representative western blot from WT cortical neuronal lysates treated with vehicle (EtOH, DMSO), Ant A, Oligo A, or CCCP for 2 hrs (concentration of drugs as indicated in the image). B MTMR5 levels normalized to total protein upon treatment of WT neurons with vehicle, Ant A, Oligo A, or CCCP for 2 hrs. C Ratio of intact MTMR2 normalized to total (intact + degraded) upon treatment of WT neurons with vehicle, Ant A, Oligo A, or CCCP for 2 hrs. D Rubicon band intensity normalized to total protein upon treatment of WT cortical neurons with vehicle, Ant A, Oligo A, or CCCP for 2 hrs (AD: N = 4 experiments, one-way ANOVA with Dunnett’s multiple comparison test). EH Lysosomal damage does not trigger the degradation of the negative regulators of autophagy. E Representative western blot from lysates of WT murine embryonic cortical neurons treated with vehicle (EtOH) or 1 mM LLOMe for 2 hrs. F Fold change in MTMR5 levels upon treatment of WT neurons with LLOMe as compared to with vehicle. G Fold change in MTMR2 levels upon treatment of WT neurons with LLOMe as compared to with vehicle. H Fold change in Rubicon levels upon treatment of WT neurons with LLOMe as compared to with vehicle (EH: N = 3 experiments, Mann–Whitney test). IM Damage to the endoplasmic reticulum does not trigger the degradation of the negative regulators of autophagy. I Representative western blot from lysates of WT murine embryonic cortical neurons treated with vehicle (DMSO) or 50 nM Tunicamycin (TM) for 3 hrs. J Fold change in ATF4 levels upon treatment of WT neurons with TM as compared to with vehicle. K Fold change in MTMR5 levels upon treatment of WT neurons with TM as compared to with vehicle. L Fold change in MTMR2 levels upon treatment of WT neurons with TM as compared to with vehicle. M Fold change in Rubicon levels upon treatment of WT neurons with TM as compared to with vehicle (IM: N = 4 experiments, Mann–Whitney test). NQ MitoSR is not triggered by mitochondrial damage in astrocytes. N Representative western blot from lysates of WT murine astrocytes treated with vehicle (EtOH, DMSO) or 5 μM Ant A, 10 μM Oligo A for 6 hrs. O Fold change in MFN-2 levels upon treatment of WT astrocytes with 5 μM Ant A, 10 μM Oligo A as compared to with vehicle. P Fold change in MTMR2 levels upon treatment of WT astrocytes with 5 μM Ant A, 10 μM Oligo A as compared to with vehicle. Q Fold change in Rubicon levels upon treatment of WT astrocytes with 5 μM Ant A, 10 μM Oligo A as compared to with vehicle (NQ: N = 4 experiments, Mann–Whitney test). Error bars indicate SEM. Source data are provided as a Source Data file.
Fig. 5
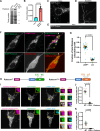
Fig. 5. Rubicon’s localization to lysosomes in neurons is RAB7-dependent.
A, B Rubicon expression is enhanced in neurons. A Representative western blot from lysates of HeLa cells or WT murine embryonic cortical neurons and probed for Rubicon. B Rubicon band intensity normalized to total protein in HeLa cells or WT neurons (N = 3 experiments, two-tailed unpaired t test). CE Rubicon localizes to organelles distributed throughout the soma, dendrites, and axons of primary cortical neurons. C Representative max projection of the soma of a WT cortical neuron transfected with EGFP-Rubicon. D Representative max projection of the dendrites of a WT cortical neuron transfected with EGFP-Rubicon. E Representative max projection of an axon of a WT cortical neuron transfected with EGFP-Rubicon. F, G Rubicon colocalizes with the late endosome/lysosome marker LAMP1-Halo but not with the autophagosome marker mCherry-LC3. F Single z-plane confocal images of the soma of a WT cortical neuron transfected with mCherry-LC3, LAMP1-Halo and EGFP-Rubicon. Yellow boxes indicate EGFP-Rubicon colocalizing with either LAMP1-Halo or mCherry-LC3. G Fraction of the number of EGFP-Rubicon puncta in the soma of each neuron colocalizing with LAMP1-Halo or mCherry-LC3 (N = 3 experiments, two-tailed unpaired t test). HK Rubicon localization to lysosomes is RAB7-dependent. H Schematics of the domain organization of RubiconWT and RubiconCGHL with the RUN, PI3K-binding domain (PIKBD) and Rubicon homology (RH) domains annotated (domains not drawn to scale). I Single z-plane confocal images of somas of neurons transfected with GFP-RAB7, LAMP1-Halo and either mCherry-RubiconWT or mCherry-RubiconCGHL. Yellow boxes indicate inset regions. J Fraction of total GFP-RAB7 area in each neuronal soma colocalizing with mCherry-RubiconWT or mCherry-RubiconCGHL. K Fraction of total Halo-LAMP1 area in each neuronal soma colocalizing with mCherry-RubiconWT or mCherry-RubiconCGHL (IK: N = 3 experiments, two-tailed unpaired t test). All panels: Error bars indicate SEM, scale bars = 5μm. Source data are provided as a Source Data file.
Fig. 6
Fig. 6. Rubicon inhibits lysosomal function and autophagosomal maturation.
AD Rubicon knockdown increases the number of lysosomes and autolysosomes in cortical neurons. A Single z-plane confocal image of neurons nucleofected with control or Rubicon shRNA and treated with DAPRed and Lysotracker. Outline of the neuronal soma for quantification is indicated using dashed lines in cyan. Yellow boxes indicate inset regions. B Fold change in lysosome numbers (marked by Lysotracker punctae) per neuronal soma in control vs Rubicon knockdown neurons. C Fold change in autophagosome numbers (marked by DAPRed punctae) per neuronal soma in control vs Rubicon knockdown neurons. D Fold change in autolysosome numbers (marked by colocalizing DAPRed and Lysotracker punctae) per neuronal soma in control vs Rubicon knockdown neurons (AD: N = 4 experiments, Mann–Whitney test). E Schematic depicting the steps of lysosomal pH detection assay in neurons using LysoPrime Green, pHLys Red to label total and acidic lysosomes, respectively, followed by treatment with 75 nM Baf A1. FI Rubicon negatively influences lysosomal acidification in neurons. F Representative max projections of neurons nucleofected with Ctrl or Rubicon shRNA and assayed for lysosomal pH using the protocol represented in (E). Outline of the neuronal soma for quantification is indicated using dashed lines in cyan G Total no. of lysosomes labeled by LysoPrime Green in control or Rubicon knockdown neurons. H No. of acidic lysosomes labeled by pHLys Red in control or Rubicon knockdown neurons. I Ratio of acidic to total lysosomes in control or Rubicon knockdown neurons (FI: N = 3 experiments, two-tailed unpaired t test). J, K Rubicon knockdown increases the number of proteolytically active lysosomes. J Single z-plane confocal images of neurons nucleofected with control or Rubicon shRNA and treated with Magic Red dye. Outline of the neuronal soma for quantification is indicated using dashed lines in cyan. K Fold change in the number of Magic Red puncta per neuronal soma in control vs Rubicon knockdown neurons (N = 5 experiments, Mann–Whitney test). (L, M) Rubicon is associated with lysosomes but not autolysosomes. L Single z-plane confocal images of a neuron transfected with EGFP-Rubicon, LAMP1-Halo and mCherry-LC3. Outline of the neuronal soma for quantification is indicated using dashed lines in cyan. Yellow boxes indicate inset regions. M Fraction of lysosomes (LAMP1-Halo) colocalizing with EGFP-Rubicon in the soma that do or do not colocalize with mCherry-LC3 (N = 3 experiments, two-tailed unpaired t test). NQ Overexpression of Rubicon inhibits autophagosome maturation. N Single z-plane confocal images of neurons transfected with mCherry-LC3, LAMP1-Halo and either EGFP or EGFP-Rubicon. Yellow boxes indicate inset regions. O Number of autophagosomes (marked by mCherry-LC3 punctae) per neuronal soma, either expressing EGFP or EGFP-Rubicon. P Number of autolysosomes (marked by colocalizing mCherry-LC3 and LAMP1-Halo puncta) per neuronal soma, either expressing EGFP or EGFP-Rubicon. Q Fraction of autolysosomes (LAMP+LC3+) to autophagosomes (LC3+) per neuronal soma either expressing EGFP or EGFP-Rubicon (NQ: N = 4 experiments, two-tailed unpaired t test). All panels: Error bars indicate SEM, scale bars = 5μm. Source data are provided as a Source Data file.
Fig. 7
Fig. 7. Depletion of MTMR2 and Rubicon promotes autophagic clearance of damaged mitochondria.
A Schematic depicting the steps of the mitophagy assay using DMP Red and Lysotracker to label acidified mitochondria and lysosomes, respectively. B, C Depletion of MTMR2 and Rubicon increases the number of mitochondria engulfed within autophagosomes. B Representative max projections of neurons nucleofected with Ctrl or Mtmr2 and Rubicon shRNA and assayed for mitophagy using the protocol represented in (A). Outline of the neuronal soma for quantification is indicated using dashed lines in cyan. Yellow boxes indicate inset regions. C Number of mitophagolysosomes per soma (marked by colocalizing DMP Red and Lysotracker punctae) of neurons nucleofected with Ctrl or Mtmr2 and Rubicon shRNA and assayed for mitophagy using the protocol represented in A (N = 4 experiments, two-tailed unpaired t-test). D–F Depletion of Rubicon is sufficient to significantly enhance mitophagic flux. D Representative max projections of neurons nucleofected with Ctrl, Mtmr2 or Rubicon shRNA and assayed for mitophagy using the protocol represented in (A). Outline of the neuronal soma for quantification is indicated using dashed lines in cyan. Yellow boxes indicate inset regions. E Number of mitophagolysosomes per soma (marked by colocalizing DMP Red and Lysotracker punctae) of neurons nucleofected with Ctrl, Mtmr2 or Rubicon shRNA and assayed for mitophagy using the protocol represented in (A). F Fold change in mitophagy flux per soma of neurons nucleofected with Ctrl, Mtmr2 or Rubicon shRNA and assayed for mitophagy using the protocol represented in (A) (DFN = 3 experiments, Kruskal–Wallis test). All panels: Error bars indicate SEM, scale bars = 5 μm. Source data are provided as a Source Data file.
Fig. 8
Fig. 8. Model: MTMR5/2 and Rubicon suppress neuronal autophagy under basal conditions, while acute mitochondrial stress induces the selective degradation of these negative regulators via MitoSR.
The upper panel depicts the roles of MTMR5/2 and Rubicon in repressing neuronal autophagy under basal conditions. MTMR5/2 activity hydrolyzes PI3P into PI, inhibiting early steps of autophagosome biogenesis. Rubicon blocks lysosomal acidification and autophagosome-lysosome fusion, thereby impacting the latter steps of autophagy. The lower panel depicts induction of MitoSR, which acts in parallel to the Pink1/Parkin pathway for mitophagy initiation in response to mitochondrial damage in neurons. Activation of MitoSR induces the ubiquitination of MTMR5, MTMR2 and Rubicon and the targeting of these negative regulators to the proteasome for degradation. MTMR5 and MTMR2 are also subject to proteolytic degradation. This concerted degradation facilitates increased autophagic flux, promoting mitochondrial turnover.

References

    1. Ernster, L. & Schatz, G. Mitochondria: a historical review. J. Cell Biol.91, 227s–255s (1981). - PMC - PubMed
    1. Vakifahmetoglu-Norberg, H., Ouchida, A. T. & Norberg, E. The role of mitochondria in metabolism and cell death. Biochem. Biophys. Res. Commun.482, 426–431 (2017). - PubMed
    1. Rangaraju, V., Lauterbach, M. & Schuman, E. M. Spatially stable mitochondrial compartments fuel local translation during plasticity. Cell176, 73–84.e15 (2019). - PubMed
    1. Misgeld, T. & Schwarz, T. L. Mitostasis in neurons: maintaining mitochondria in an extended cellular architecture. Neuron96, 651–666 (2017). - PMC - PubMed
    1. Devine, M. J. & Kittler, J. T. Mitochondria at the neuronal presynapse in health and disease. Nat. Rev. Neurosci.19, 63–80 (2018). - PubMed

Substances

LinkOut - more resources