. 2025 Aug 9;10(1):38.
doi: 10.1038/s41536-025-00425-y.

Prx1+ progenitors give rise to new articular cartilage when conditions are permissive for endogenous regeneration

Affiliations

Prx1+ progenitors give rise to new articular cartilage when conditions are permissive for endogenous regeneration

Christina L Jablonski et al. NPJ Regen Med. .

Abstract

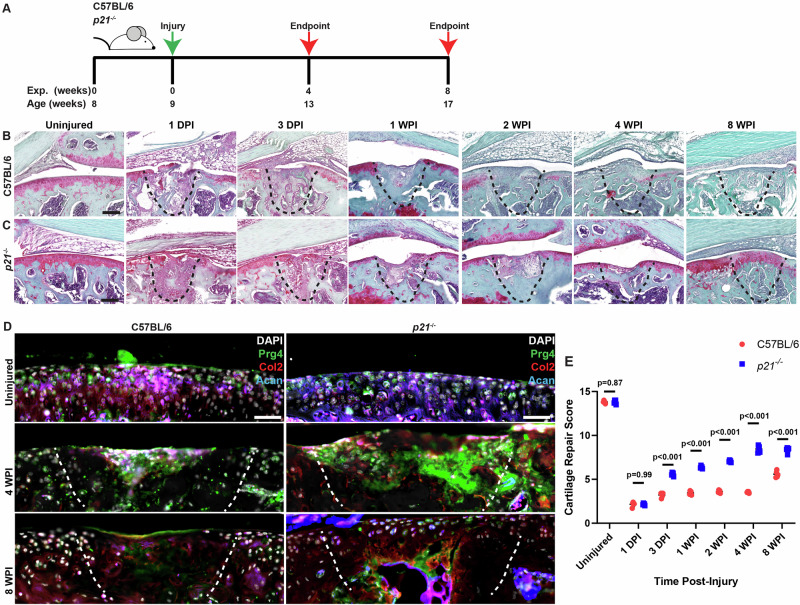
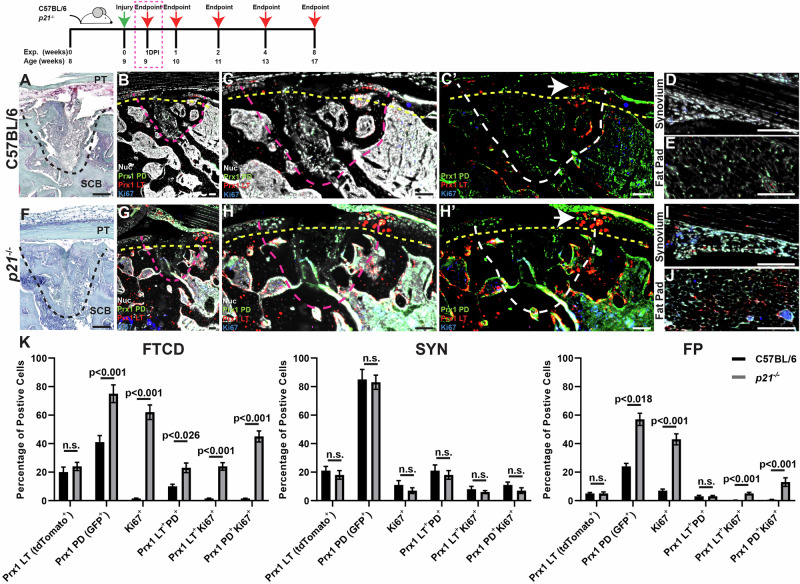
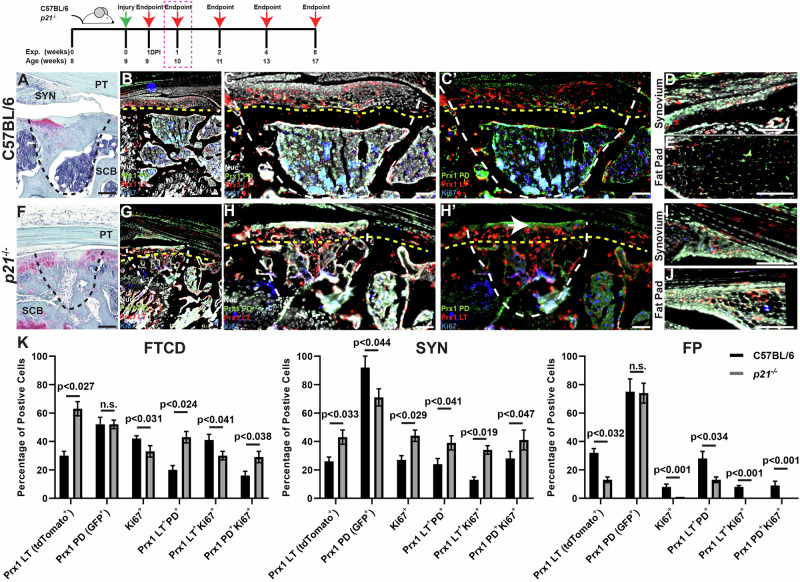
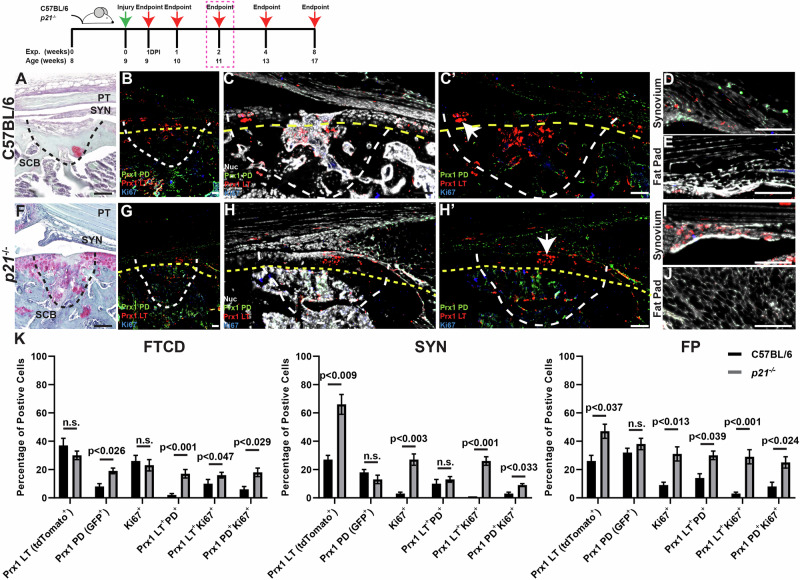
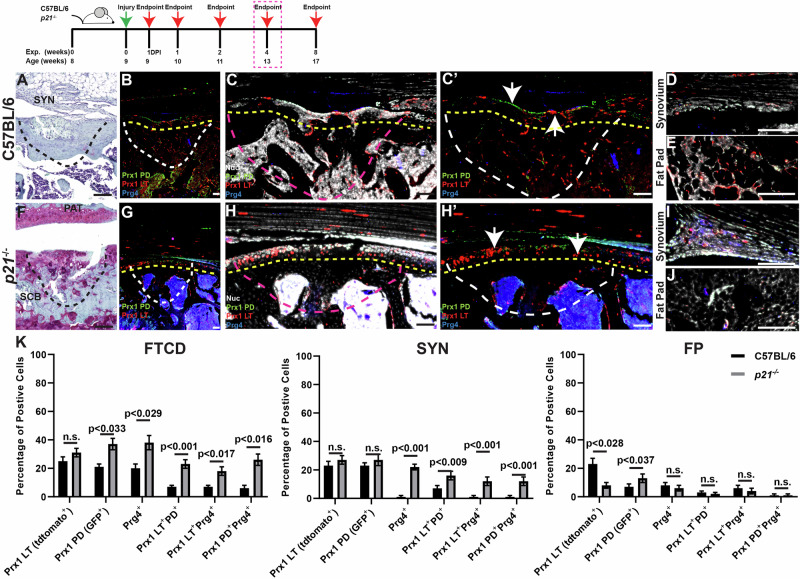
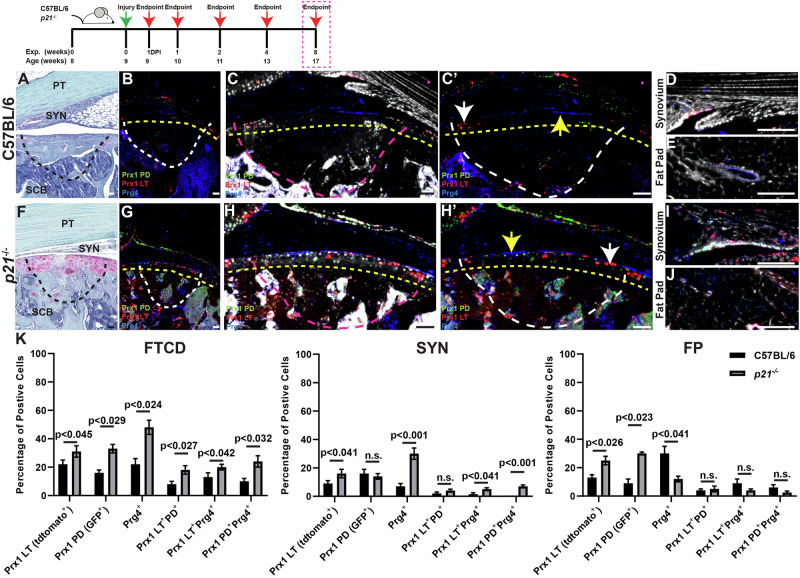
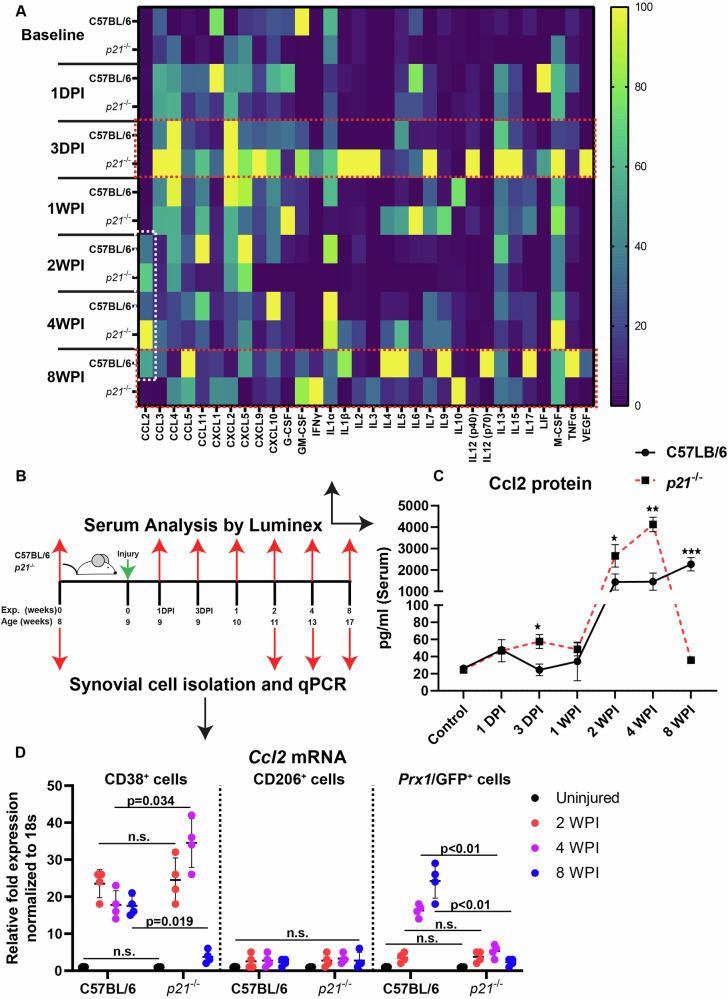
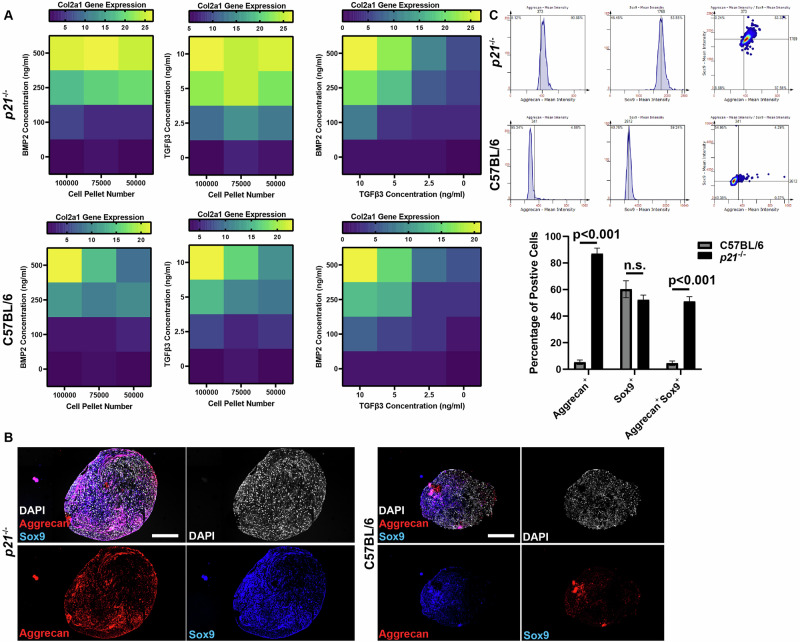
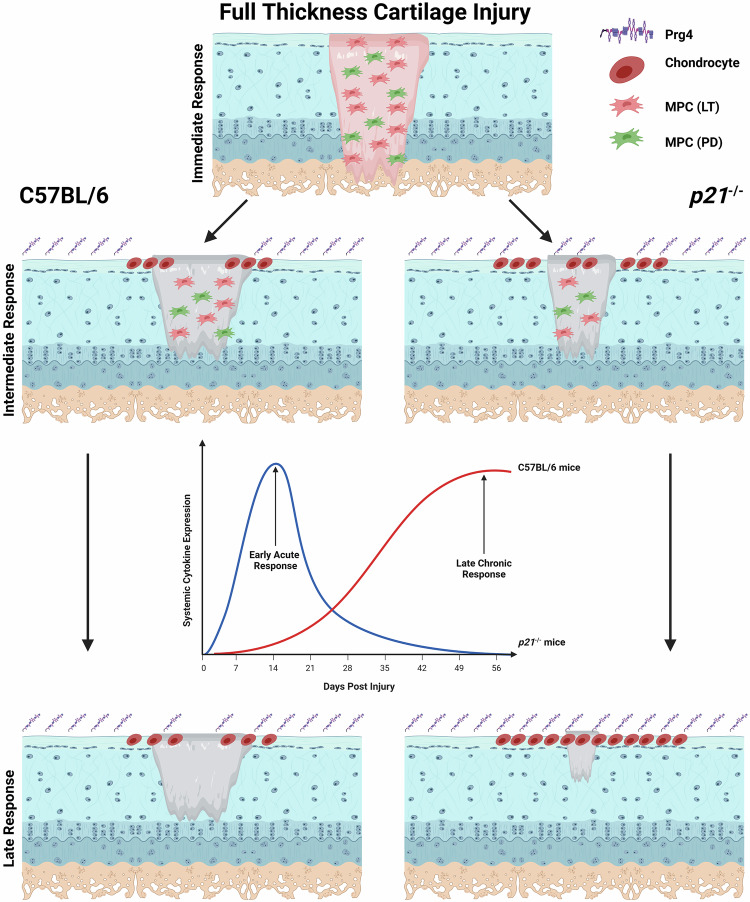
It is widely acknowledged that articular cartilage lacks the ability to regenerate. However, if such regeneration were possible, which cell type would generate new tissue? The p21-/- mouse provides an excellent platform to explore this question, hence, we conducted lineage tracing on Paired related homeobox 1 (Prrx1/Prx1) cells post-injury to determine whether endogenous Prx1+ cells contribute to regenerated tissues post-injury. p21-/- mice displayed enhanced endogenous cartilage regeneration, accompanied by notable differences in the number and kinetics of Prx1+ cells within and around the injury site. In p21-/- mice, Prx1+ cells underwent chondrogenesis, ultimately contributing to the regenerated articular cartilage layer. These findings underscore the impact of tissue-resident cells on cartilage regeneration, albeit under abnormal conditions. If the conditions within the joint could be manipulated to favor such a regenerative environment, these endogenous cell types might be recruited to facilitate the formation of a new articular cartilage surface post-injury.


Conflict of interest statement

Competing interests: The authors declare no competing interests.

Figures

Fig. 1
Fig. 1. Outcomes of articular cartilage repair following FTCD.
The experimental outline (A) is depicted, followed by representative Safranin O stained sections depicting uninjured articular cartilage as the injury site post-FTCD in C57BL/6 (B) and p21−/− (C) mice. Fluorescent images (D) show the localization of Prg4 and Col2 and Acan within the uninjured cartilage and the FTCD area at 4 and 8 weeks post-injury (WPI) for C57BL/6 and p21−/− mice (n = 5 mice for each group at each timepoint). Cartilage healing was assessed using a grading scale (E) in sagittal tissue sections from both C57BL/6 and p21−/− mice (n = 5 mice per strain per timepoint). A T-test was used to determine significance (p < 0.05) between strains at each timepoint. Scale bars are equal to 50 µm.
Fig. 2
Fig. 2. Prx1+ MPCs (Mesenchymal Progenitor Cells) in mouse knee joints at 1 day post-injury (DPI).
The top section provides a diagrammatic representation of the experimental design and time-points. Safranin O stained sections shown the injury site in both C57BL/6 (A–C) and p21−/− mice (F–H). Fluorescent images depict the localization of Prx1 (non-lineage traced/promoter driven GFP expression in green; lineage traced in red) progenitors and Ki67/proliferating cells (blue) within the cartilage defect area (B, C, G, H), adjacent synovium (D, I), and fat pad (E, J) in both C57BL/6 and p21−/− mice. In images A-E, C57BL/6 mice are shown, while images F-J represent p21−/− mice. Notably, arrows in C’ and H’ (lacking the Nuc channel) highlight tdTomato+ cells within the articular cartilage at the margin of the FTCD (arrows). Cell quantification was performed within three regions: FTCD, SYN, and FP, utilizing a tissue cytometry approach (K). A T-test was used to determine significance (p < 0.05) between strains at each timepoint for each marker. An n = 5 mice per strain per timepoint was used in this experiment. All values are expressed as mean ± standard deviation (SD). Scale bars are equal to 50 µm. The white dotted lines outline the cartilage injury site, the yellow dotted lines mark the boundary between the articular cartilage and subchondral bone.
Fig. 3
Fig. 3. Prx1+ MPCs in mouse knee joints at 1 WPI.
The top panel illustrates the experimental design and time-points. Safranin O stained sections shown the injury site in both C57BL/6 (A) and p21−/− mice (F). Fluorescent images depict the localization of Prx1 progenitors (non-lineage traced/promoter driven GFP expression in green; lineage traced in red) and Ki67/proliferating cells (blue) within the cartilage defect area (B, C, G, H), adjacent synovium (D, I), and fat pad (E, J) in both C57BL/6 (A–E) and p21−/− mice (F–J), with arrows in H’ indicating GFP+ cells lining the articular cartilage at the surface of the FTCD. Images C’ and H’ have the Nuc channel removed. Cell quantification was performed within three regions: FTCD, SYN, and FP using tissue cytometry (K). A T-test was used to determine significance (p < 0.05) between strains at each timepoint for each marker. An n = 5 mice per strain per timepoint was used in this experiment. All values are expressed as mean ± standard deviation (SD). Scale bars are equal to 50 µm. The white dotted lines outline the cartilage injury site, the yellow dotted lines mark the boundary between the articular cartilage and subchondral bone.
Fig. 4
Fig. 4. Prx1+ MPCs in mouse knee joints at 2 WPI.
The top panel illustrates the experimental design and time-points. Safranin O stained sections shown the injury site in both C57BL/6 (A) and p21−/− mice (F). Fluorescent images depict the localization of Prx1 progenitors (non-lineage traced/promoter driven GFP expression in green; lineage traced in red) and Ki67/proliferating cells (blue) within the cartilage defect area (B, C, G, H), adjacent synovium (D, I), and fat pad (E, J) in both C57BL/6 and p21−/− mice. Images C’ and H’ have the Nuc channel removed. Arrows highlight tdTomato+ cells within the articular cartilage surface of the full-thickness cartilage defect (FTCD). Cell quantification was performed within three regions: FTCD, SYN, and FP using tissue cytometry (K). A T-test was used to determine significance (p < 0.05) between strains at each timepoint for each marker. An n = 5 mice per strain per timepoint was used in this experiment. All values are expressed as mean ± standard deviation (SD). Scale bars are equal to 50 µm. The white dotted lines outline the cartilage injury site, the yellow dotted lines mark the boundary between the articular cartilage and subchondral bone.
Fig. 5
Fig. 5. Prx1+ MPCs in mouse knee joints at 4 WPI.
The diagram illustrates the experimental design and time-points. Safranin O stained sections shown the injury site in both C57BL/6 (A) and p21−/− mice (F). Fluorescent images depict the distribution of Prx1 progenitors (non-lineage traced/promoter driven GFP expression in green; lineage traced in red) and Prg4 expression (blue) in the cartilage defect area (B, C, G, H), adjacent synovium (D, I), and fat pad (E, J) of both C57BL/6 and p21−/− mice. GFP+ and tdTomato+ cells within the articular cartilage surface of the full-thickness cartilage defect (FTCD) are highlighted with arrows (C’H’). Images C’ and H’ have the Nuc channel removed. Cell quantification was performed in three regions (FTCD, SYN, and FP) using tissue cytometry (K). A T-test was used to determine significance (p < 0.05) between strains at each timepoint for each marker. An n = 5 mice per strain per timepoint was used in this experiment. All values are expressed as mean ± standard deviation (SD). Scale bars are equal to 50 µm. The white dotted lines outline the cartilage injury site, the yellow dotted lines mark the boundary between the articular cartilage and subchondral bone.
Fig. 6
Fig. 6. Prx1+ MPCs in mouse knee joints at 8 WPI.
The diagram illustrates the experimental design and time-points. Safranin O stained sections shown the injury site in both C57BL/6 (A) and p21−/− mice (F). Fluorescent images depict the distribution of Prx1 progenitors (non-lineage traced/promoter driven GFP expression in green; lineage traced in red) and Prg4 expression (blue) in the cartilage defect area (B, C, G, H), adjacent synovium (D, I), and fat pad (E, J) of both C57BL/6 and p21−/− mice. GFP+ and tdTomato+ cells within the articular cartilage surface of the full-thickness cartilage defect (FTCD) are highlighted with white arrows (C’H’), while Prg4 expression is identified by the yellow arrows. Images C’ and H’ have the Nuc channel removed. Cell quantification was performed in three regions (FTCD, SYN, and FP) using tissue cytometry (K). A T-test was used to determine significance (p < 0.05) between strains at each timepoint for each marker. An n = 5 mice per strain per timepoint was used in this experiment. All values are expressed as mean ± standard deviation (SD). Scale bars are equal to 50 µm. The white dotted lines outline the cartilage injury site, the yellow dotted lines mark the boundary between the articular cartilage and subchondral bone.
Fig. 7
Fig. 7. Differential regulation of cytokines post-injury between strains.
A Luminex assay measuring 32 cytokines was undertaken on serum in both strains (A). The 2 columns that are highlighted in red dashed boxes indicate timepoints where a number of differences were observed. The white vertical dashed box represents differences in Ccl2 expression between strains. Graphical representation of the experimental design (B). Changes in serum Ccl2 levels over time and between strains (C). Quantification of Ccl2 mRNA expression in CD38+, CD206+ and GFP+ cells isolated from the synovium of both strains over time (D). *=p < 0.05, **=p < 0.01, ***=p < 0.001.
Fig. 8
Fig. 8. Differentiation potential of Prx1 MPCs from p21−/− and C57BL/6 mice.
GFP+ cells isolated from the synovium of p21−/− and C57BL/6 mice were induced to undergo chondrogenesis in vitro. The initial start density of cells/pellet, Bmp2 concentration and Tgfβ3 concentration were all used as input variables while the expression of Col2a1 mRNA was employed as the outcome measure (A). Immunofluorescence of Aggrecan and Sox2 was used to validate chondrogenesis (B) and the expression of these markers were quantified using a tissue cytometry approach (C).
Fig. 9
Fig. 9. A model of how Prx1 MPCs and differentially systemic inflammatory response result in increased cartilage regeneration in p21−/− mice.
p21⁻/⁻ mice exhibit superior articular cartilage regeneration compared to C57BL/6 mice, forming hyaline-like cartilage with increased Prx1⁺ cell activity and proliferation. In p21⁻/⁻ mice, Prx1⁺ MPCs migrate immediately into defect site and differentiate more effectively, contributing to improved cartilage restoration from both the wound margin and center. In contrast, C57BL/6 mice show limited repair and delayed or ineffective progenitor response. Additionally, p21⁻/⁻ mice demonstrate transient, tightly regulated inflammatory cytokine expression (e.g., Ccl2), while C57BL/6 mice exhibit persistent inflammation, hindering regeneration and favoring joint degeneration over time. This image was made with Biorender.

Similar articles

References

    1. Hunter, W. VI. Of the structure and diseases of articu­lating cartilages. Philos. Trans. R. Soc. Lond.42, 514–521 (1743).
    1. Charalambous, C. P. The response of articular cartilage to mechanical injury. Class. Pap. Orthop.64, 381–383 (2014).
    1. Das, N. et al. Tryptase β regulation of joint lubrication and inflammation via proteoglycan-4 in osteoarthritis. Nat. Commun.14, 1910 (2023). - PMC - PubMed
    1. Jay, G. D. et al. Prevention of cartilage degeneration and restoration of chondroprotection by lubricin tribosupplementation in the rat following anterior cruciate ligament transection. Arthritis Rheum.62, 2382–2391 (2010). - PMC - PubMed
    1. Krawetz, R. J. et al. Mesenchymal progenitor cells from non-inflamed versus inflamed synovium post-ACL injury present with distinct phenotypes and cartilage regeneration capacity. Stem Cell Res. Ther.14, 168 (2023). - PMC - PubMed

LinkOut - more resources