. 2025 Aug 9;8(1):1189.
doi: 10.1038/s42003-025-08585-9.

The role of environmentally mediated drug resistance in facilitating the spatial distribution of residual disease

Affiliations

The role of environmentally mediated drug resistance in facilitating the spatial distribution of residual disease

Amy Milne et al. Commun Biol. .

Abstract

The development of de novo resistance is a major disadvantage in molecularly targeted therapies. While much focus is on cell-intrinsic mechanisms, the microenvironment is also known to play a crucial role. This study examines interactions between cancer cells and cancer associated fibroblasts (CAFs) to understand the local crosstalk facilitating residual disease. Using a hybrid-discrete-continuum model, we explore how treatment-induced stress responses can elicit CAF activation and how breaks in treatment allow microenvironment normalisation. We investigate how fluctuating environmental conditions shape the local crosstalk and ultimately drive residual disease. Our experimentally calibrated model identifies environmental and treatment conditions that allow tumour eradication and those that enable survival. We find two distinct mechanisms that underpin residual disease: vasculature-limited drug delivery and CAF-mediated rescue. This work provides a better understanding of the mechanisms that drive the creation of localised residual disease, crucial to informing the development of more effective treatment protocols.


Conflict of interest statement

Competing interests: The authors declare no competing interests.

Figures

Fig. 1
Fig. 1. Key interactions between cancer cells and the TME proposed in the model.
Cancer cell, formula image
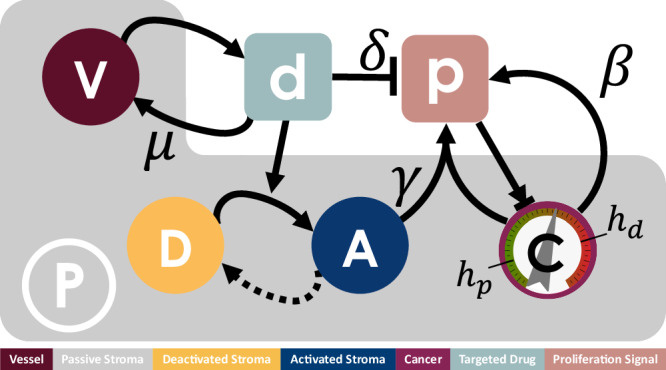
, behaviour is dependent on the local concentration of the proliferation signal, formula image, with thresholds for death, hd, and proliferation, hp. Cancer cells provide autocrine promotion of local proliferation signal at rate β. TME comprises of both passive, formula image, and reactive stroma. Reactive stroma can be in either an activated, formula image, or deactivated, formula image, state. A targeted inhibitor drug, formula image, depletes proliferation signal at rate δ and is removed from the system through vessel sites formula image at rate μ. Local concentration of targeted drug above threshold hr triggers activation of reactive stroma cells adjacent to a cancer cell, in turn providing paracrine promotion of the proliferation signal at rate γ. Activated reactive stroma reverts to a deactivated state if the drug concentration falls below hr.
Fig. 2
Fig. 2. Exploration of treatment scheduling.
a Tumour burden for t ∈ [0, 240] days under no treatment, continuous treatment, and five intermitted treatment schedules (τT = {10, 30, 50} days and τH = 20 days). Individual realisations are shown, with 30 stochastic simulations conducted for each treatment regime. Reduction in tumour burden is observed as the length of the treatment period τT of intermittent treatment increases. Continuous treatment initially displays a very good response to treatment, followed by EMDR-driven relapse. bh show spatial distribution and drug concentration at representative time points for a single simulation of the regime of interest. b Day 0, the initial condition for all simulations. c Day 51 of no treatment. d Day 181 of continuous treatment regime. e Day 150 of intermittent treatment (τT = 10 days, τH = 20 days) regime. f Day 100 of intermittent treatment (τT = 30 days, τH = 20 days) regime. g Day 150 of intermittent treatment (τT = 50 days, τH = 20 days) regime. h Day 181 of intermittent treatment (τT = 50 days, τH = 20 days) regime. Animations of the proliferation signal, spatial distribution and drug concentration for each treatment regime are available in Supplementary Information S.5.
Fig. 3
Fig. 3. Quantification of treatment regime outcomes.
a Cumulative days of drug delivery (measured as the sum of drug delivery days over 590 days of therapy) against relative tumour burden (measured as the sum of total cancer cell count over the t ∈ [0, 590] day window normalised to the continuous treatment case) for τT=10,20,30,40,50,60,70,80,90,100 days and τH = 20 days. For each schedule, averages over 30 simulations and 95% confidence intervals are shown. The star indicates reference measures for continuous treatment. As τT is increased, relative tumour burden initially decreases and cumulative days of drug delivery increases, but from τT = 50 days, the relative tumour burden increases. b The inset zooms in on measures for schedules with τT ≥ 40 days. The treatment regime τT = 50 days, τH = 20 days is chosen for further analysis.
Fig. 4
Fig. 4. Exploration of spatial attributes of EMDR.
a Timecourse of a single representative simulation of treatment schedule τT = 50 and τH = 20 over 590 days. Drug concentration mean field value; cancer cell populations; and activated stroma cell populations. b Spatial distribution of cells at 245, 315 and 385 days, corresponding to lowest total cancer cell population in treatment cycles away from the initial transient (corresponding time points are indicated in a). c, d Longitudinal occupancy of cancer and stroma, respectively, in the domain for t ∈ [150, 590] days (discarding transient) over 30 simulations. Occupancy is measured as fraction of time a lattice location in the domain is occupied by the cell type of interest. e Distributions of average number of cancer cell neighbours of cancer cells and activated stroma in the activation window over the same 30 simulations in (c, d) (discarding transient) with standard error shown. Here the activation window is the last 60% of the 50 days treatment window. Animations of the spatial distribution, proliferation signal and drug concentrations for treatment regime τT = 50 days, τH = 20 days are available in Supplementary Information S.5.
Fig. 5
Fig. 5. Niche characterisation: cell neighbourhoods and local vessel density.
a Cell distributions at day 526 from a single representative simulation. Zoomed-in insets are examples of a survival niche (S), an eradication niche (E) and a persistence niche (P). b Vessel density measure, ρ(x), over the domain, for the static vessel distribution V. Here α^=0.1. Boxes tracing the same regions considered in (a), show higher ρ in the survival niche compared to the eradication niche, and lowest ρ in the persistence niche. c Distributions of different cell types of neighbours to cancer cells, over the t ∈ [0, 590] days window, for the same 30 simulations as Fig. 4. Distributions of average cancer, passive stroma and activated stroma neighbours of cancer cells with standard errors in each niche are shown.
Fig. 6
Fig. 6. Investigation of vessel density and treatment outcomes.
Distribution of cells at day 139 from single representative simulations with increasing vessel density. Vessel sites are determined to reflect a target density across the domain (see Supplementary Information S.6 for details). Increasing mean field ρ values are 0.54 × 10−3, 1.63 × 10−3, 2.18 × 10−3, 2.73 × 10−3, 3.28 × 10−3, 3.82 × 10−3, 4.38 × 10−3 and 4.94 × 10−3. Treatment failure due to poor perfusion of the drug (PPF) is evident for low vessel density, while EMDR drives treatment failure for higher vessel densities.
Fig. 7
Fig. 7. Targeted drug spatio-temporal dynamics over a treatment cycle.
Drug concentration, d, for the third treatment cycle (drug delivery + holiday period) with yellow highlight for locations where dhr. Representative eradication (E), survival (S) and persistence (P) niches are the same as in Fig. 5. a Drug concentration in the middle of the treatment period. The survival niche has a larger fraction of above-threshold locations. The eradication niche has a very low fraction of above-threshold locations and the persistence niche has no locations above the threshold. b Drug concentration near the end of the delivery period. Above-threshold locations now cover the entirety of the survival niche, and a large fraction of the eradication niche. There is a very small fraction of locations above the threshold in the persistence niche.
Fig. 8
Fig. 8. Proliferation signal modulation over a treatment cycle.
Proliferation signal, p, during the third treatment cycle with yellow highlight for locations where p ≥ hp (proliferation window) and black highlight for locations where p < hd (death window). Representative eradication (E), survival (S) and persistence (P) niches are the same as in Figs. 5 and 7. a At the start of the drug delivery period all three niches contain locations where the proliferation signal is above hd, forming a bulk region in the survival and persistence niches, and small sparse clusters in the eradication niche. Regions in the proliferative window are only present in the survival niche. b In the middle of the drug delivery period a small number of locations in the survival niche remain in the proliferative window. The proliferation signal in the eradication and persistence niches is significantly depleted, with no locations in the proliferative window. c By the end of the drug delivery period in the survival niche the region in the proliferative window has increased through cancer proliferation and further stroma activation. The eradication niche is almost entirely in the death window, although limited regions in the proliferation window indicate late activation of stroma. There are no such locations in the persistence niche, which is largely in the quiescent window. d Towards the end of the drug holiday period, in the eradication and persistence niches no locations are in the proliferative window. In the survival niche the region in the proliferative window which appeared during drug delivery expands further, while other locations move from the death to the quiescent window.

Similar articles

References

    1. Xiao, Y. et al. Recent progress in targeted therapy for non-small cell lung cancer. Front. Pharmacol. 14, 1125547 (2023). - PMC - PubMed
    1. Gouda, M. A. & Subbiah, V. Precision oncology for BRAF-mutant cancers with BRAF and MEK inhibitors: from melanoma to tissue-agnostic therapy. ESMO Open8, 100788 (2023). - PMC - PubMed
    1. Singh, H. Role of molecular targeted therapeutic drugs in treatment of breast cancer: A Review Article. Glob. Med Genet10, 79–86 (2023). - PMC - PubMed
    1. Zhong, L. et al. Small molecules in targeted cancer therapy: advances, challenges, and future perspectives. Sig Transduct. Target Ther.6, 201 (2021). - PMC - PubMed
    1. Bedard, P. L., Hyman, D. M., Davids, M. S. & Siu, L. L. Small molecules, big impact: 20 years of targeted therapy in oncology. Lancet395, 1078–1088 (2020). - PubMed

MeSH terms

Substances

LinkOut - more resources