. 2025 Aug 9;11(1):155.
doi: 10.1038/s41522-025-00763-1.

Periodontitis-associated Fusobacterium nucleatum promotes ulcerative colitis by ferroptosis-mediated gut barrier disruption

Affiliations

Periodontitis-associated Fusobacterium nucleatum promotes ulcerative colitis by ferroptosis-mediated gut barrier disruption

Xiaoyue Zhang et al. NPJ Biofilms Microbiomes. .

Erratum in

Abstract

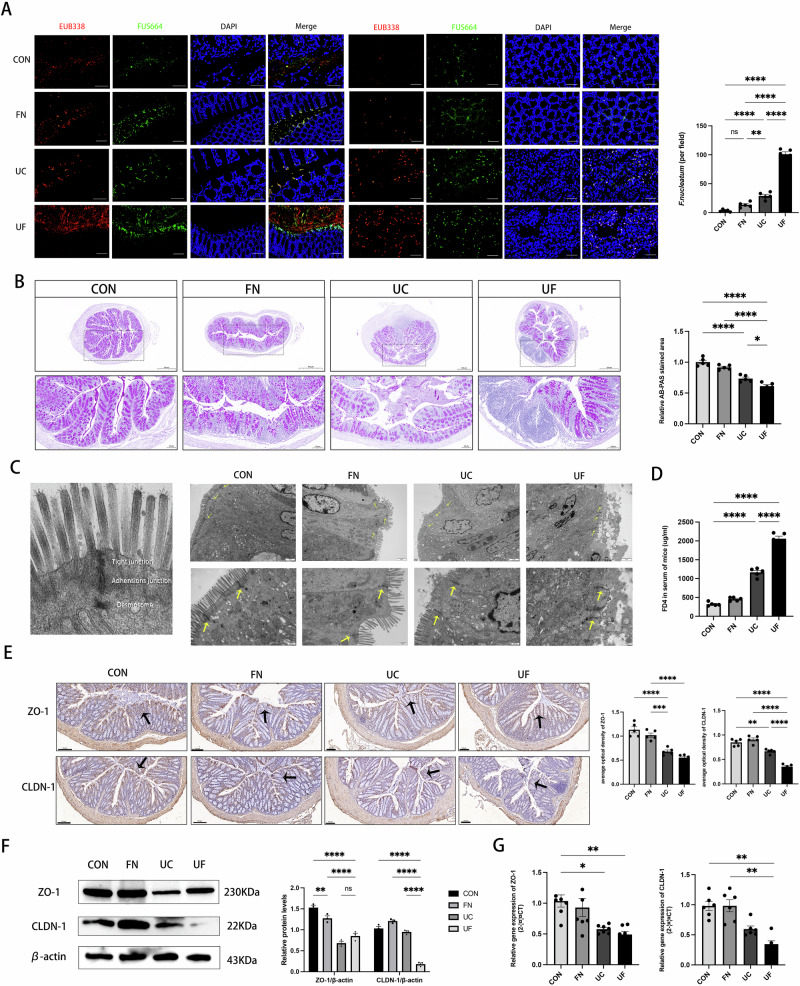
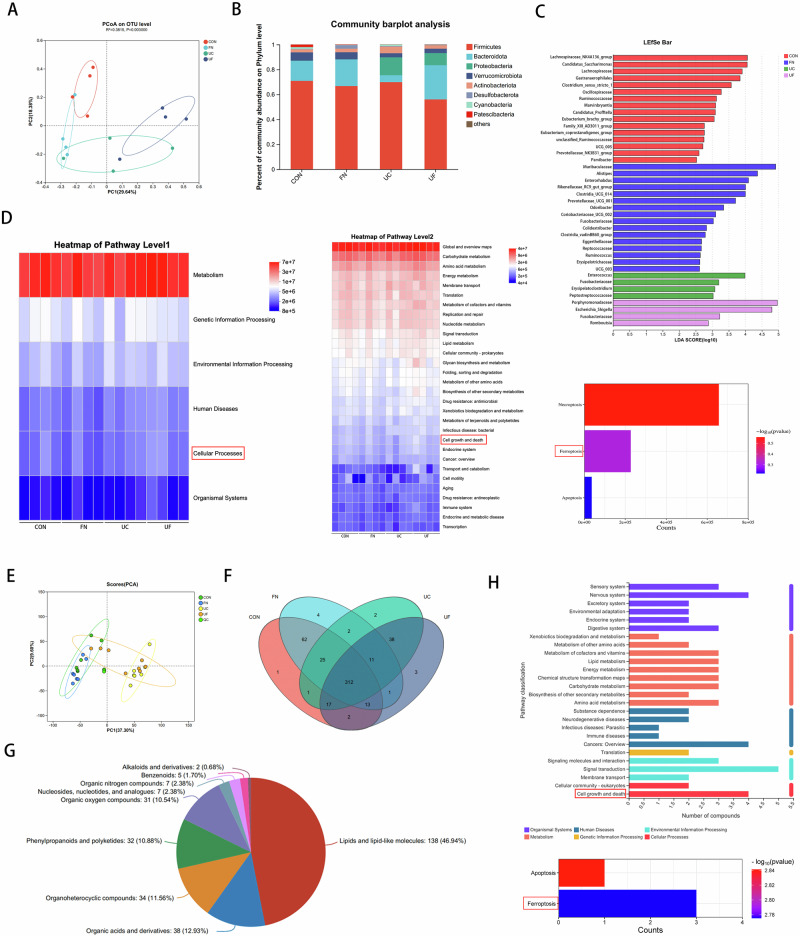
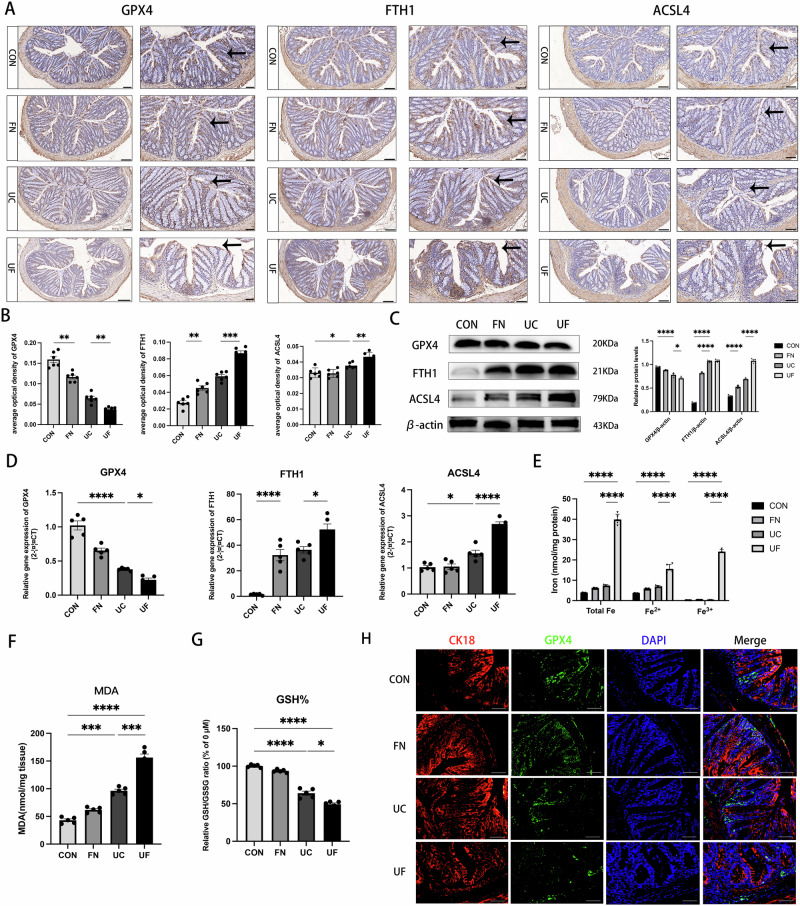
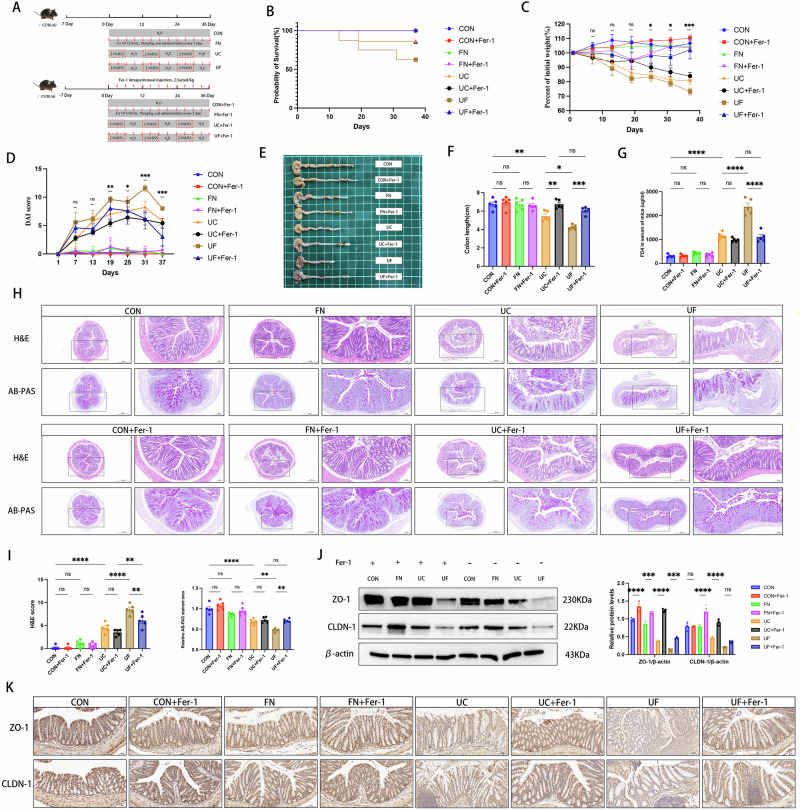
Periodontitis and ulcerative colitis (UC) are inflammatory diseases linked through the "gum-gut" axis. Fusobacterium nucleatum, an important periodontitis-associated pathobiont and gastrointestinal opportunist, may mediate their comorbidity. This study investigated the role of F. nucleatum in UC using dextran sulfate sodium-induced UC and F. nucleatum-induced periodontitis models. F. nucleatum exacerbated inflammatory alveolar bone loss and intestinal barrier dysfunction, accelerating UC severity. Integrated 16S rRNA gene sequence and LC-MS metabolomics revealed ferroptosis activation, characterized by elevated Fe2+ and malondialdehyde, glutathione depletion, dysregulated GPX4, FTH1, and ACSL4 expression, reduced mitochondrial membrane potential, and reactive oxygen species aggregation in the mouse colon and colonic epithelial cell CCD841. Administration of ferroptosis inhibitor Ferrostatin-1 attenuated UC by restoring intestinal permeability, preserving mucin layers, and enhancing tight junction proteins ZO-1 and CLDN-1. These findings establish F. nucleatum as a key mediator of periodontitis-UC comorbidity through ferroptosis-mediated gut barrier disruption, providing mechanistic insights into microbial-driven inflammatory cross-talk.


Conflict of interest statement

Competing interests: The authors declare no competing interests.

Figures

Fig. 1
Fig. 1. F.nucleatum promoted periodontal and intestinal destruction in mice.
A Schematic representation and study design. B The survival rate of mice (% of initial) (n = 10). C Weight change of mice (% of initial) (n = 10). D Disease activity index (DAI) scores of mice (n = 10). E Representative images of the colon and F quantification of colon length (scale: 1 cm) (n = 5). G Histological images of the colon (scale: 50 μm) (left) and the H&E score (right). Yellow “*” indicates inflammatory cell infiltration, and yellow arrows indicate epithelial disruption (n = 8). H Histological images of the periodontium (scale: 200 μm). AL alveolar bone, PDL periodontal ligament, D dentin, black arrows: stripped junction epithelium (n = 5). I Representative Micro CT images (scale: 10 μm), Yellow line: ABC, red line: CEJ (n = 5). J The analysis of the distance from the cement-to-enamel junction-alveolar bone crest, CEJ-ABC (mm), the value of bone volume/tissue volume, BV/TV (%), bone surface area-tissue volume ratio, (BS/TV) (1/mm) and the trabecular separation, Td.Sp (mm). All data represent the mean ± SEM. Each dot indicated an individual mouse. *P < 0.05, **p < 0.01, ***P < 0.001, ****p < 0.0001, by one-way or two-way ANOVA, followed by a post hoc test.
Fig. 2
Fig. 2. F.nucleatum promoted intestinal barrier disruption in UC mice.
A Representative fluorescence in situ hybridization (FISH) image assessing the amount of F.nucleatum in the intestinal lumen and intestinal tissue of mice (left) and the quantification in panel (right). EUB338 (red) is a Cy3-conjugated universal bacterial oligonucleotide probe, FUS664 (green) is a FAM-conjugated F. nucleatum-specific oligonucleotide probe (scale: 50 μm) (n = 5). B Alcian blue/periodic acid-Schiff (AB-PAS) staining of the colon (left) and the relative quantification of the stained area (right) (scale: 500 μm, up; 100 μm, down) (n = 5). C Transmission electron microscopy (TEM) of the physiologic structure of the epithelial junction complex of the mouse colon (left). TEM of mice intestinal epithelium, with yellow arrowheads indicating the junction complex (scale: 2 μm, up; 500 nm, down) (right) (n = 5). D FITC-dextran (FD4) permeability assay evaluated mice intestinal epithelial permeability (n = 5). E Immunohistochemical staining for ZO-1 and CLDN-1 of mice colon (scale: 100 μm) and the average optical density was shown on the right side. F Western blotting analysis of ZO-1 and CLDN-1 of mice colon and quantification. β-actin was used as the loading control (n = 3). G RT-qPCR measured the relative mRNA levels of ZO-1 and CLDN-1 in the colon of mice. All data represent the mean ± SEM. Each dot indicated an individual mouse. *P < 0.05, **p < 0.01, ***P < 0.001, ****p < 0.0001, by one-way or two-way ANOVA, followed by a post hoc test.
Fig. 3
Fig. 3. F.nucleatum promoted UC development associated with ferroptosis.
A Principal coordinate analysis (PCoA) was performed on unweighted uniFrac distances to analyze differences in microbial community structure. B Community barplot analysis on phylum level. C The most differentially abundant taxa of characteristic microorganisms by LEfSe (LDA >2). LDA Score: linear discriminant analysis score. D PICRRUSt2 functional prediction heatmap (KEGG functional abundance statistics). The horizontal coordinate is the group name, the vertical coordinate is the pathway level 1/2/3 functional name, and the color gradient of the color block shows the change of different functional abundance in the group. E Principal component analysis (PCA): Samples (including QC samples) were subjected to principal component analysis, which provided a preliminary understanding of the overall metabolic differences between the four groups and the magnitude of variability between samples within groups. F Venn Diagram: Understand the metabolite composition of different groups, different colors represent different subgroups, overlapping numbers represent the number of metabolites common to multiple subgroups, and non-overlapping numbers represent the number of metabolites specific to the corresponding subgroups. G Comparison of the HMDB 4.0 database to obtain taxonomic information and statistical mapping of metabolites. H Metabolomic analysis of intestinal contents in mice. The vertical coordinate is the secondary classification of the KEGG metabolic pathway, and the horizontal coordinate is the number of compounds annotated to the pathway.
Fig. 4
Fig. 4. F.nucleatum induced ferroptosis in the colon of UC mice.
A Immunohistochemical staining for GPX4, FTH1, and ACSL4 (scale: 100 μm, left; 50 μm, right). Black arrows indicated expression-positive cells. B The average optical density of GPX4, FTH1, and ACSL4 was shown on the right side (n = 6). C Western blotting analysis of GPX4, FTH1, and ACSL4 and quantification. β-actin was used as the loading control (n = 3). D RT-qPCR measured the relative mRNA levels of GPX4, FTH1, and ACSL4 (n = 5). E Iron Assay Kit determined the iron levels (n = 5). F MDA Assay Kit measured the MDA levels (n = 5). G GSH and GSSG Assay Kit measured the relative GSH/ GSSG ratio (GSH%) (n = 5). H Double immunofluorescent staining for GPX4 and cytokeratin 18 (CK18) (scale: 50 μm) (n = 3). Each dot indicated an individual mouse. All data represent the mean ± SEM. *P < 0.05, **p < 0.01, ***P < 0.001, ****p < 0.0001, by one-way or two-way ANOVA, followed by a post hoc test.
Fig. 5
Fig. 5. F. nucleatum induced ferroptosis in the colonic epithelial cells.
A CCK-8 Assay Kit determined the cell survival (%) of CCD-841(n = 6). B LDH Assay Kit determined the LDH releasing (%) of CCD-841(n = 6). C MDA Assay Kit measured the MDA levels of CCD-841(n = 6). D GSH and GSSG Assay Kit measured the relative GSH/ GSSG ratio (GSH%) of CCD-841(n = 6). E Western blotting analysis of GPX4, FTH1, and ACSL4 and quantification. ɑ-tubulin was used as the loading control (n = 3). F RT-qPCR measured the relative mRNA level of GPX4, FTH1, and ACSL4 (n = 6). G FeRhoNox-1 fluorescence staining for detecting Fe2+ of CCD-841 and quantification were shown on the right (n = 6). H Immunohistochemical staining for GPX4, FTH1, and ACSL4 (scale: 200 μm, left; 100 μm, right). The average optical density of GPX4, FTH1, and ACSL4 were shown on the right (n = 6). After the introduction of Fer-1 and DFO, I C11-BODIPY staining assessed the ROS level of CCD-841 and quantification (n = 3). Oxidation state BODIPY signal (green), reduction state signal (red). J JC-1 fluorescence staining detected the mitochondrial membrane potential (MMP) of CCD-841 and quantification. When MMP is high, JC-1 aggregates in the matrix of mitochondria and produces red fluorescence; at lower MMP, green fluorescence is produced (n = 3). Each dot indicated an individual mouse. All data represent the mean ± SEM. *P < 0.05, **p < 0.01, ***P < 0.001, ****p < 0.0001, by one-way or two-way ANOVA, followed by a post hoc test.
Fig. 6
Fig. 6. Ferroptosis inhibitor rescued F. nucleatum-induced intestinal barrier disruption in UC mice.
A Schematic representation and study design. B The survival rate of mice (% of initial) (n = 10). C Weight change of mice (% of initial) (n = 10). D DAI scores of mice (n = 10). E Representative images of the colon and F quantification of colon length (scale: 1 cm) (n = 5). G FD4 permeability assay evaluated mice intestinal epithelial permeability (n = 5). H Histological images and AB-PAS staining of the colon (scale: 500 μm, left; scale: 100 μm, right) (n = 5). I H&E score (left) and the relative quantification of the stained area (right) (n = 5). J Western blotting analysis of ZO-1 and CLDN-1 of mice colon and quantification. β-actin was used as the loading control (n = 3). K Immunohistochemical staining for ZO-1 and CLDN-1 of mice colon (scale: 50, 100 μm) and the average optical density was shown on the right side. Each dot indicated an individual mouse. All data represent the mean ± SEM. *P < 0.05, **p < 0.01, ***P < 0.001, ****p < 0.0001, by one-way or two-way ANOVA, followed by a post hoc test.

References

    1. Febbraio, M., Roy, C. B. & Levin, L. Is there a causal link between periodontitis and cardiovascular disease? A concise review of recent findings. Int. Dent. J. 72, 37–51 (2022). - PMC - PubMed
    1. AlSharief, M. & Alabdurubalnabi, E. Periodontal pathogens and adverse pregnancy outcomes: a narrative review. Life13, 1559 (2023). - PMC - PubMed
    1. Wang, H. et al. Clonal hematopoiesis driven by mutated DNMT3A promotes inflammatory bone loss. Cell187, 3690–3711.e19 (2024). - PMC - PubMed
    1. Di Spirito, F. et al. The association between periodontitis and human colorectal cancer: Genetic and pathogenic linkage. Life10, 1–18 (2020). - PMC - PubMed
    1. Zhang, Y. et al. The association between periodontitis and inflammatory bowel disease: a systematic review and meta-analysis. Biomed Res. Int. 10.1155/2021/6692420 (2021). - PMC - PubMed

MeSH terms

Grants and funding

LinkOut - more resources