. 2025 Aug 9;16(1):7350.
doi: 10.1038/s41467-025-61954-0.

UHRF2 mediates resistance to DNA methylation reprogramming in primordial germ cells

Affiliations

UHRF2 mediates resistance to DNA methylation reprogramming in primordial germ cells

Ambre Bender et al. Nat Commun. .

Abstract

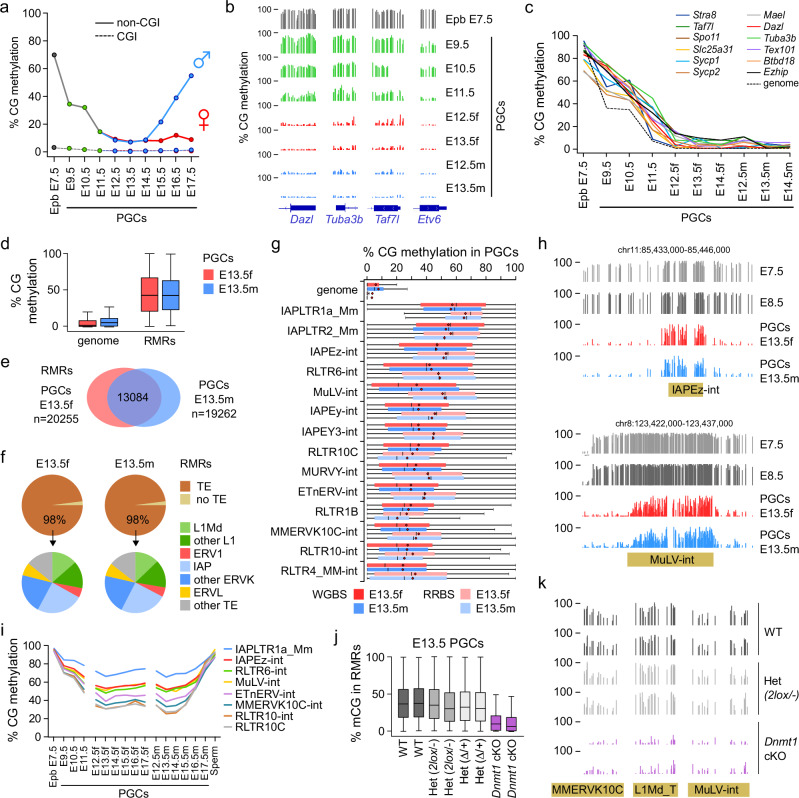
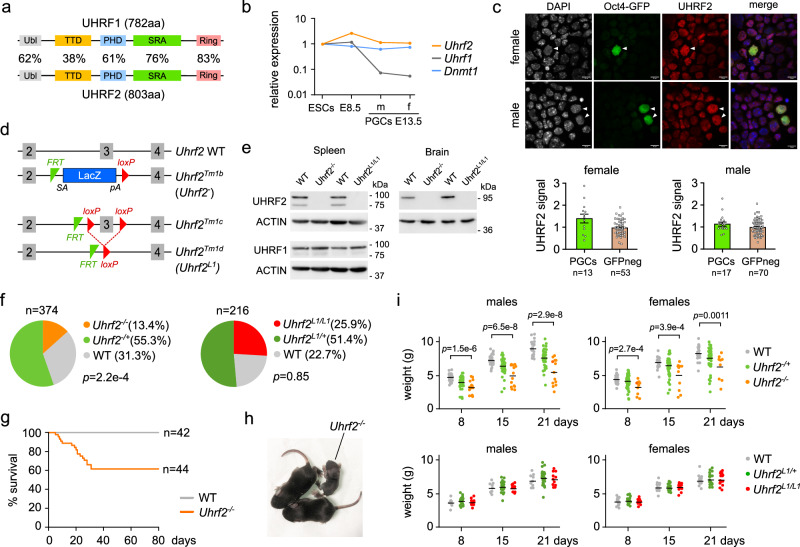
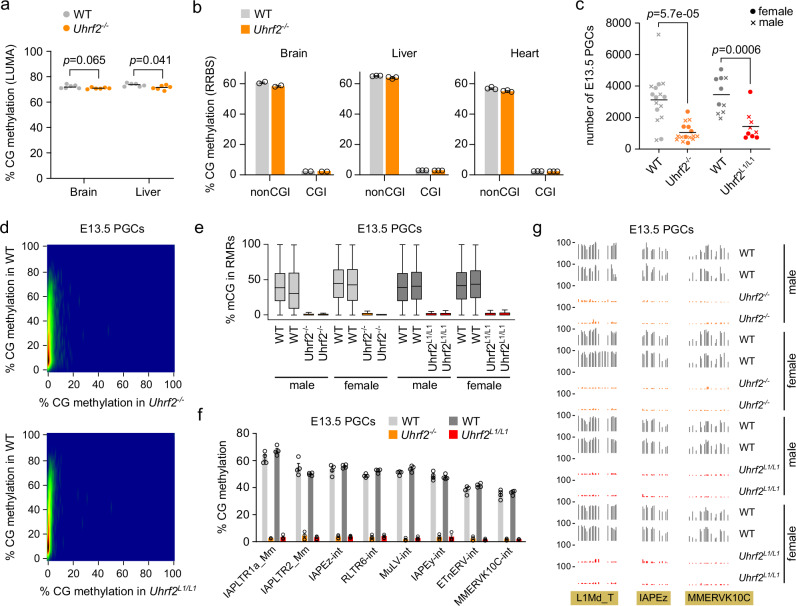
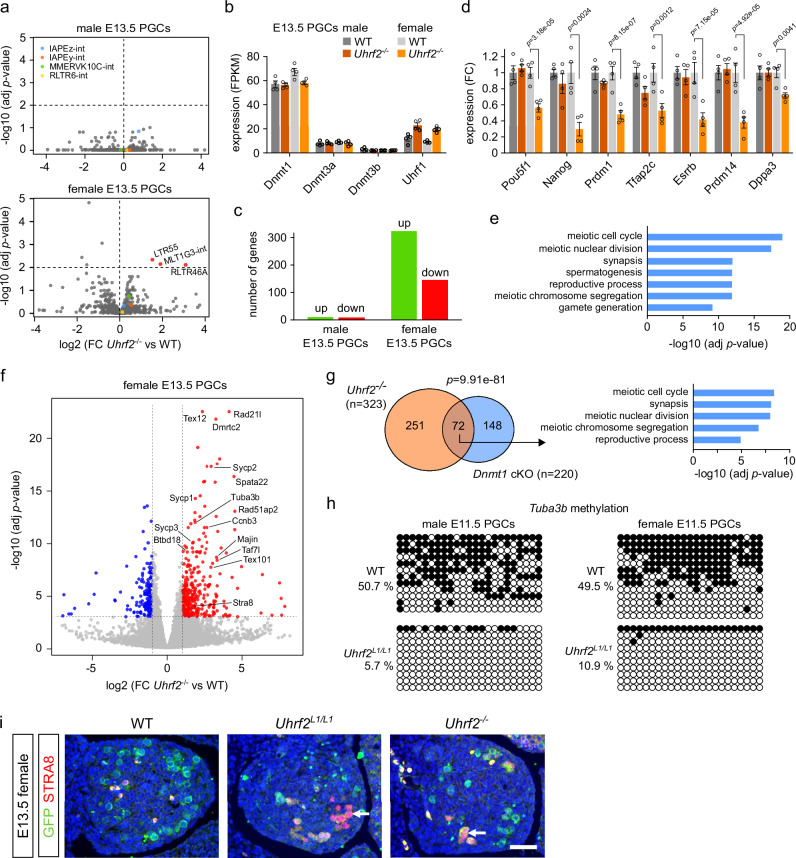
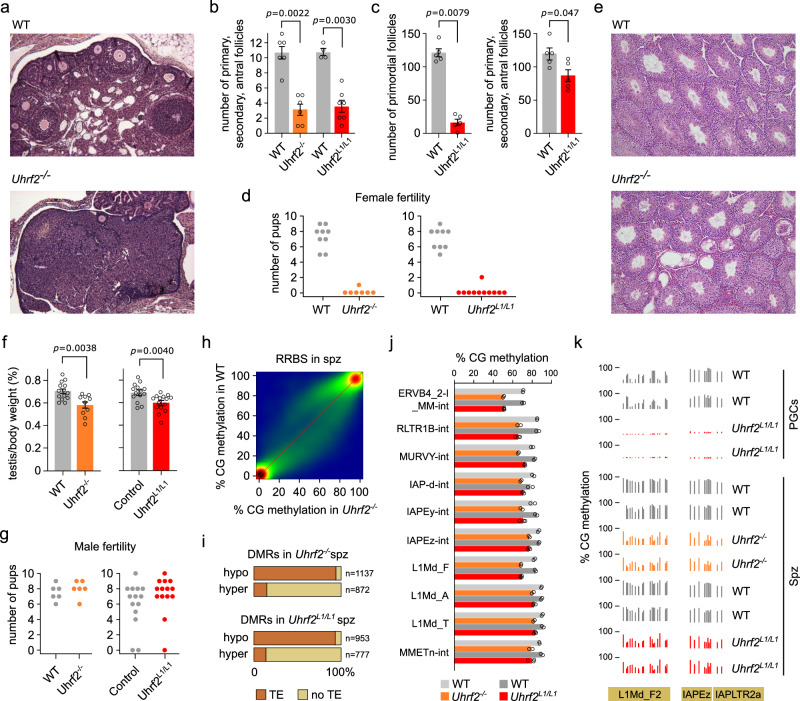
In mammals, primordial germ cells (PGCs) undergo global erasure of DNA methylation with delayed demethylation of germline genes and selective retention of DNA methylation at evolutionarily young retrotransposons. However, the molecular mechanisms of persistent DNA methylation in PGCs remain unclear. Here we report that resistance to DNA methylation reprogramming in PGCs requires UHRF2, the paralog of the DNMT1 cofactor UHRF1. PGCs from Uhrf2 knock-out mice show loss of retrotransposon DNA methylation, while DNA methylation is unaffected in somatic cells. This is not associated with changes in the expression of retrotransposons in E13.5 PGCs, indicating that other mechanisms compensate for retrotransposon control at this stage. Furthermore, Uhrf2-deficient PGCs show precocious demethylation of germline genes and overexpress meiotic genes in females. Subsequently, Uhrf2-deficient mice show impaired oocyte development and female-specific reduced fertility, as well as incomplete remethylation of retrotransposons during spermatogenesis. These findings reveal a crucial function for the UHRF1 paralog UHRF2 in controlling DNA methylation in the germline.


Conflict of interest statement

Competing interests: The authors declare no competing interests.

Figures

Fig. 1
Fig. 1. Selective maintenance of DNA methylation in PGCs requires DNMT1.
a Global CG methylation levels measured by RRBS in E7.5 epiblast (Epb) and throughout PGC development. Methylation is represented separately for CGs in CpG islands (CGI, dashed lines) and outside of CpG islands (non-CGI, full lines). The average number of covered CpGs per sample is n = 599,050 for CGI and n = 560,437 for non-CGI. b RRBS methylation profiles in CG-rich promoters of three germline genes (Dazl, Tuba3b, Taf7l), and as a control in an exonic sequence of the Etv6 gene (chr6:134,266,250-134,266,500). Each bar represents the methylation of one CG dinucleotide. c Kinetics of methylation erasure in PGCs in the promoters of germline genes compared to the whole genome. For the whole genome, we represent the median methylation of all CGs with a methylation > 50% in epiblast and <20% in E13.5 PGCs. d Boxplots of methylation levels of individual CpGs within residually methylated regions (RMRs) compared to the whole genome in female and male E13.5 PGCs (n = 18,909,193 CpGs for the whole genome, n = 350,807 CpGs for RMRs). e Venn diagram of the overlap between RMRs in female and male E13.5 PGCs. f Pie charts showing the distribution of various transposable element (TE) families in RMRs. g Methylation of the top methylated retrotransposon families compared to the whole genome in E13.5 PGCs. The boxplots show the distribution of methylation levels of individual CpGs overlapping with individual copies of each retrotransposon family in the WGBS or RRBS datasets. On average, 69% and 12% of the total number of individual genomic copies are covered in the WGBS and RRBS datasets, respectively. The numbers of CpGs and individual copies covered in each dataset are given in the source data file. h Examples of WGBS methylation profiles of retrotransposons carrying persistent methylation in E13.5 PGCs. i Quantification of CG methylation levels by RRBS for top methylated retrotransposon families throughout PGC development. j Boxplots of methylation levels of individual CpGs within RMRs measured by RRBS in Dnmt1 cKO E13.5 PGCs compared to littermate controls (WT n = 35024 CpGs, WT n = 33610 CpGs, Het n = 32389 CpGs, Het n = 31170 CpGs, Het n = 26439 CpGs, Het n = 23172 CpGs, cKO n = 27940 CpGs, cKO n = 24732 CpGs). k Examples of RRBS methylation profiles of retrotransposons in Dnmt1 cKO and control E13.5 PGCs (MMERVK10C chr18: 68,779,000 − 68,779,300; L1Md_T chr8: 91,423,000 − 91,423,500; MuLV-int chr8:123,427,900-123,428,800). Boxplots: center line indicates the median, red dot indicates the mean, box limits indicate upper and lower quartiles, whiskers extend to 1.5 interquartile range. Source data are provided as a Source Data file.
Fig. 2
Fig. 2. Expression of Uhrf2 in PGCs and characterization of Uhrf2 knockout mice.
a Structure of the mouse UHRF1 and UHRF2 proteins. The percentage of sequence identity for each domain is indicated. b Expression of Uhrf2, Uhrf1 and Dnmt1 genes measured by RNA-seq in ESCs, E8.5 embryos, and male (m) and female (f) E13.5 PGCs (represented as a fold change relative to ESCs). Raw FPKM values are provided in the source data file. c Immunofluorescence analysis of UHRF2 in cells from E13.5 female or male gonads expressing Oct4-GFP. DNA was stained with DAPI and an anti-GFP antibody was used to identify GFP-positive PGCs. Scale bars: 10 μM. PGCs are highlighted by white arrowheads. The graphs show quantifications of UHRF2 signal normalized to GFP-negative cells (mean ± SEM, the sample sizes are indicated below the graphs). d Schematic representation of the Uhrf2 knockout alleles used in the study. e Western blot of UHRF2 and UHRF1 proteins in spleen and brain from PND10 Uhrf2-deficient and WT mice. ACTIN was used as a loading control. The experiment was repeated independently three times. f Distribution of genotypes among 8-day-old pups obtained from Uhrf2-/+ × Uhrf2-/+ (left) or Uhrf2L1/+ × Uhrf2L1/+ (right) crosses (p-values: Chi square tests compared to the expected 1:2:1 mendelian distribution). g Postnatal survival curves of Uhrf2-/- compared to littermate WT mice. h Photograph of an Uhrf2-/- mouse showing growth retardation at PND10 compared to its littermates. i Body weights of Uhrf2-/- mice compared to heterozygous and WT littermates obtained from crosses between Uhrf2-/+ parents (top), and Uhrf2L1/L1 mice compared to heterozygous and WT littermates obtained from crosses between Uhrf2L1/+ parents (bottom). Body weights were measured 8, 15 and 21 days after birth. The bars represent the mean of the distributions. p-values: two-sided Mann-Whitney tests. Source data are provided as a Source Data file.
Fig. 3
Fig. 3. Uhrf2 is required for DNA methylation in PGCs but not in somatic cells.
a Global CG methylation levels measured by LUMA in brain and liver of Uhrf2-/- compared to WT PND21 animals (n = 6 animals per genotype). Horizontal bars: mean, p-values: two-sided Mann-Whitney tests. b Quantification of CG methylation by RRBS in brain, liver and heart of Uhrf2-/- compared to WT PND21 animals. Methylation levels are shown separately for CGs outside of CpG islands (non CGI) or in CpG islands (CGI). Data are presented as mean ± SEM (n = 2 animals per genotype for brain, n = 3 animals for liver and heart). c Number of PGCs recovered by flow cytometry from gonads of Uhrf2-mutant compared to littermate WT E13.5 embryos (WT n = 16 embryos, Uhrf2-/- n = 16, WT n = 10, Uhrf2L1/L1 n = 9). Horizontal bars: mean, p-values: two-sided Mann–Whitney tests. d Correlation of RRBS CG methylation scores in 500 bp windows in E13.5 PGCs from Uhrf2-/- and Uhrf2L1/L1 compared to their littermate WT embryos (average of n = 4 embryos per genotype). Only tiles with a methylation above 5% in WT PGCs are shown in these graphs. e Boxplots of methylation levels of individual CpGs within RMRs in male and female Uhrf2-/- and Uhrf2L1/L1 compared to WT E13.5 PGCs. Each boxplot represents an independent animal (male WT n = 43422 CpGs, WT n = 27170 CpGs, Uhrf2-/- n = 32317 CpGs, Uhrf2-/- n = 41483 CpGs, female WT n = 46505 CpGs, WT n = 41505 CpGs, Uhrf2-/- n = 32272 CpGs, Uhrf2-/- n = 21081 CpGs, male WT n = 32084 CpGs, WT n = 34058 CpGs, Uhrf2L1/L1 n = 33392 CpGs, Uhrf2L1/L1 n = 32894 CpGs, female WT n = 33909 CpGs, WT n = 34215 CpGs, Uhrf2L1/L1 n = 31816 CpGs, Uhrf2L1/L1 n = 26752 CpGs). Boxplots: center line indicates the median, box limits indicate upper and lower quartiles, whiskers extend to 1.5 interquartile range. f Mean methylation levels of ERV families in male and female Uhrf2-/- and Uhrf2L1/L1 compared to WT E13.5 PGCs (mean ± SEM, n = 4 embryos per genotype). g Examples of RRBS methylation profiles of retrotransposons in Uhrf2-mutant and WT E13.5 PGCs (L1Md_T chr8: 91,423,000–91,423,500; IAPEz chr18: 55,320,600–55,320,800; MMERVK10C chr16: 31,218,700–31,219,000). Source data are provided as a Source Data file.
Fig. 4
Fig. 4. Uhrf2 inactivation leads to increased expression of meiotic genes but not retrotransposons in E13.5 PGCs.
a Volcano plots showing differential expression of TE families in male and female Uhrf2-/- E13.5 PGCs. Significantly upregulated TE families (padj<0.01) are highlighted in red. P-values: DESeq2 adjusted p-values. b FPKM expression values of Dnmt and Uhrf1 genes in Uhrf2-/- compared to WT E13.5 PGCs (mean ± SEM, n = 4 animals). c Number of significantly upregulated and downregulated genes identified in male and female Uhrf2-/- E13.5 PGCs. d Expression of regulators of pluripotency and germline identity in Uhrf2-/- compared to WT E13.5 PGCs (fold change relative to the WT of the same sex, mean ± SEM, n = 4 animals, p-values: DESeq2 adjusted p-values). The legend is the same as in b. e Gene ontology terms significantly enriched among genes upregulated in female Uhrf2-/- E13.5 PGCs. f Volcano plot showing differential gene expression in female Uhrf2-/- compared to WT E13.5 PGCs. Significantly upregulated and downregulated genes are highlighted in red and blue respectively. The names of some upregulated meiotic genes are indicated. P-values: DESeq2 adjusted p-values. g Venn diagram showing the overlap between the genes upregulated in Uhrf2-/- and Dnmt1-cKO E13.5 PGCs. p-value: hypergeometric test. Gene ontology terms significantly enriched among common genes are shown on the right. h Bisulfite sequencing analysis of the Tuba3b promoter in Uhrf2L1/L1 compared to WT E11.5 PGCs. Each row represents a sequenced clone (white dots: unmethylated CpGs, black dots: methylated CpGs). i Detection of meiotic cells by immunostaining of STRA8 (red nuclear signal) on ovarian sections from control (WT) and mutant E13.5 fetuses, as indicated. Immunostaining of Oct4-GFP (green signal) was used to detect the PGCs. Nuclei are counterstained with DAPI (blue signal). The white arrows point to STRA8-positive, meiotic, germ cells. The experiment was repeated independently at least on four gonads for each genotype. Scale bar: 30 µm. Source data are provided as a Source Data file.
Fig. 5
Fig. 5. Uhrf2 inactivation impairs oocyte development and retrotransposon methylation in sperm.
a Histological sections of ovaries stained by H&E in a WT and Uhrf2-/- female at PND80. The experiment was repeated independently on six gonads for each genotype. b Number of primary, secondary and antral follicles counted in sections of PND80 ovaries from Uhrf2-mutant and WT littermate females (mean ± SEM, WT n = 6 females, Uhrf2-/- n = 6 females, WT n = 4 females, Uhrf2L1/L1 n = 7 females, p-values: two-sided Mann–Whitney tests). c Number of primordial follicles (left) and primary, secondary and antral follicles (right) counted in serial sections of PND15 ovaries from Uhrf2L1/L1 and WT littermate females (mean ± SEM, n = 5 females per genotype, p-values: two-sided Mann–Whitney tests). d Number of pups born from Uhrf2-deficient females compared to their WT littermate controls. e Representative examples of histological sections of testis stained by H&E in a WT and Uhrf2-/- male at PND80. The experiment was repeated independently on six gonads for each genotype. f Testis-to-body weight ratios in PND80 Uhrf2-deficient males compared to their littermate controls (mean ± SEM, WT n = 14 males, Uhrf2-/- n = 10 males, WT n = 14 males, Uhrf2L1/L1 n = 15 males, p-values: two-sided Welch’s t-tests). Uhrf2L1/L1 males were compared to WT and Uhrf2L1/+ heterozygotes. g Number of pups born from crosses with Uhrf2-deficient males compared to their littermate controls. h Correlation of RRBS CG methylation scores in 500 bp windows in Uhrf2-/- compared to WT spermatozoa (average of n = 2 animals per genotype). i Proportion of DMRs identified in Uhrf2-deficient spermatozoa that colocalize with transposable elements (TEs). j Mean methylation levels of selected ERV and L1 families in Uhrf2-deficient compared to WT spermatozoa (n = 2 or 3 animals per genotype). k Two examples of sequences in retrotransposons hypomethylated in Uhrf2-deficient PGCs and spermatozoa (L1Md_F2 chr4: 63,921,700–63,922,300; IAP chr19: 13,269,700 − 13,269,900). Source data are provided as a Source Data file.

Similar articles

References

    1. Bourc’his, D. & Bestor, T. H. Meiotic catastrophe and retrotransposon reactivation in male germ cells lacking Dnmt3L. Nature431, 96–99 (2004). - PubMed
    1. Barau, J. et al. The DNA methyltransferase DNMT3C protects male germ cells from transposon activity. Science (1979)354, 909–912 (2016). - PubMed
    1. Okano, M., Bell, D. W., Haber, D. A. & Li, E. DNA methyltransferases Dnmt3a and Dnmt3b are essential for de novo methylation and mammalian development. Cell99, 247–257 (1999). - PubMed
    1. Dahlet, T. et al. Genome-wide analysis in the mouse embryo reveals the importance of DNA methylation for transcription integrity. Nat. Commun.11, 3153 (2020). - PMC - PubMed
    1. Smith, Z. D. et al. A unique regulatory phase of DNA methylation in the early mammalian embryo. Nature484, 339–344 (2012). - PMC - PubMed

LinkOut - more resources