. 2025 Aug 9;16(1):7373.
doi: 10.1038/s41467-025-61699-w.

A multivalent mRNA vaccine elicits robust immune responses and confers protection in a murine model of monkeypox virus infection

Affiliations

A multivalent mRNA vaccine elicits robust immune responses and confers protection in a murine model of monkeypox virus infection

Yansheng Li et al. Nat Commun. .

Abstract

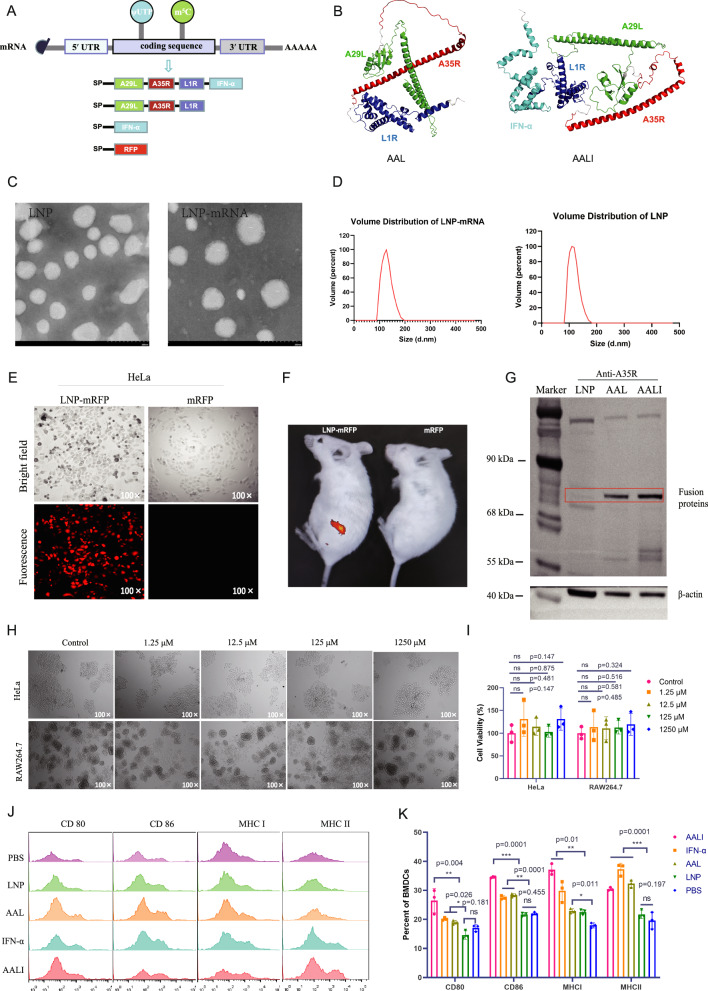
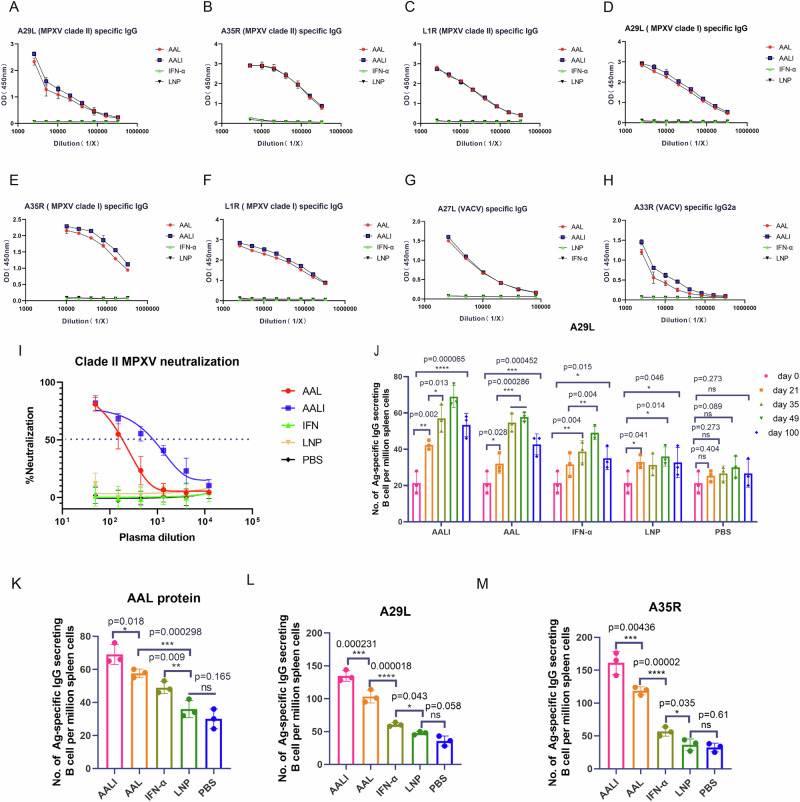
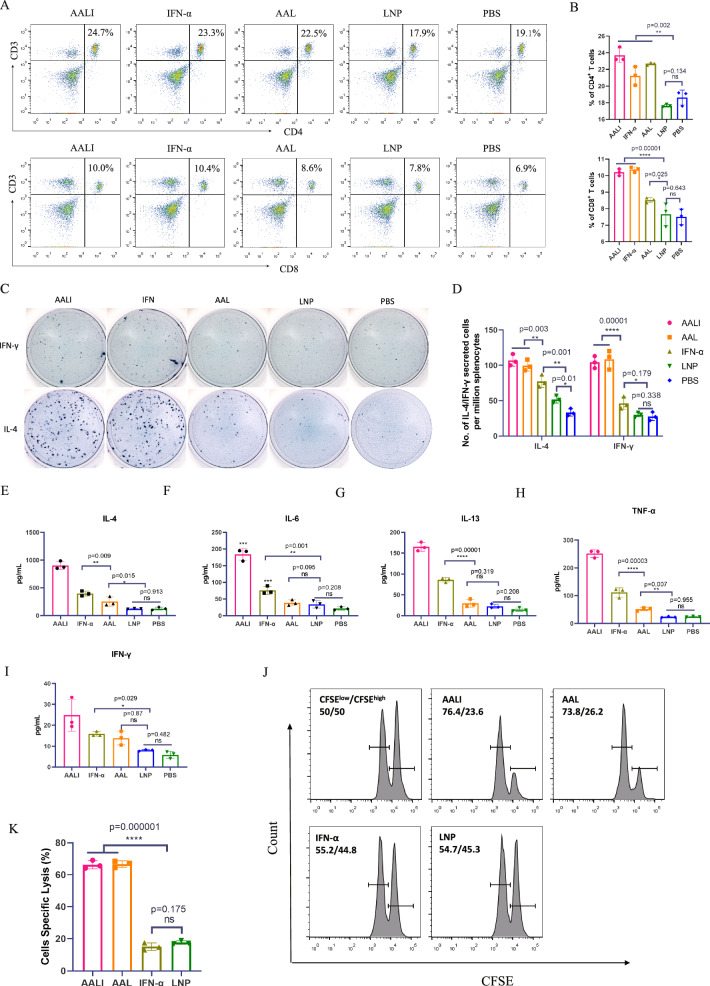
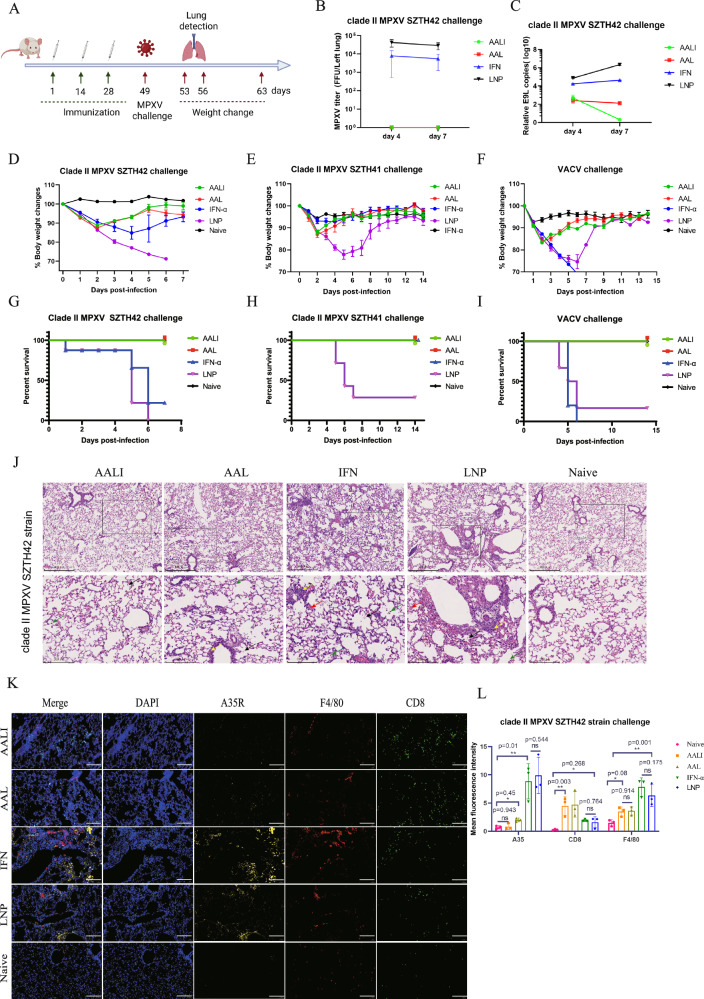
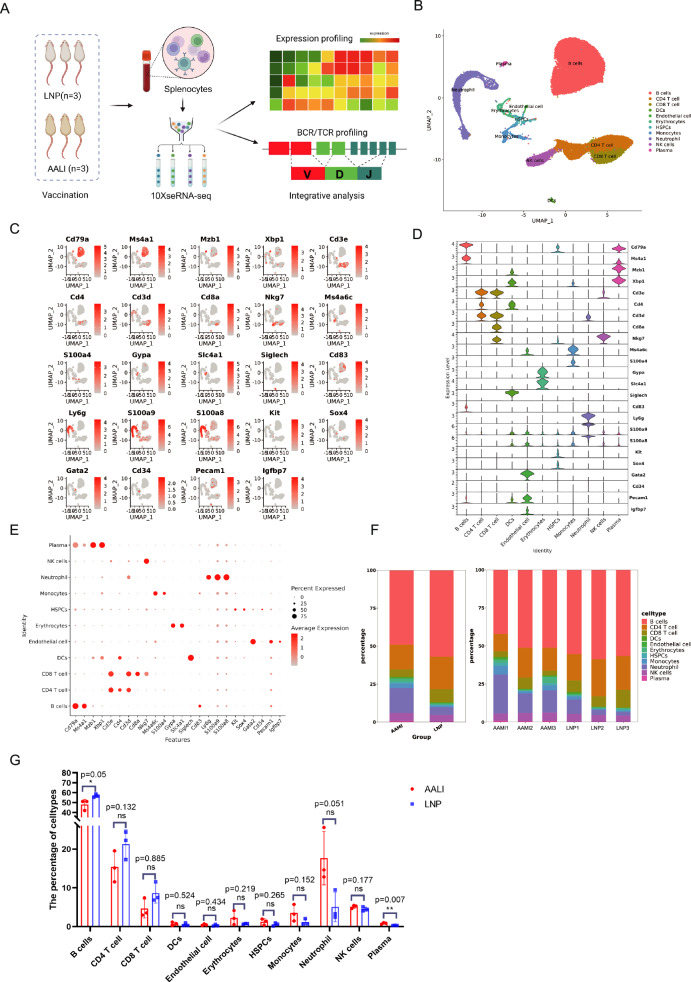
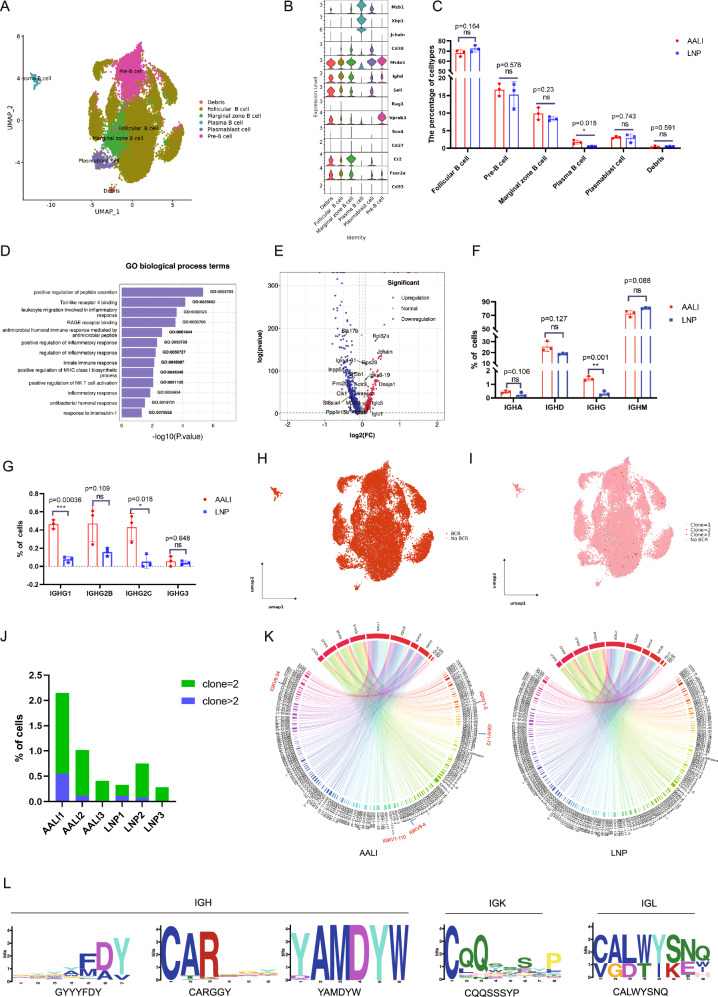
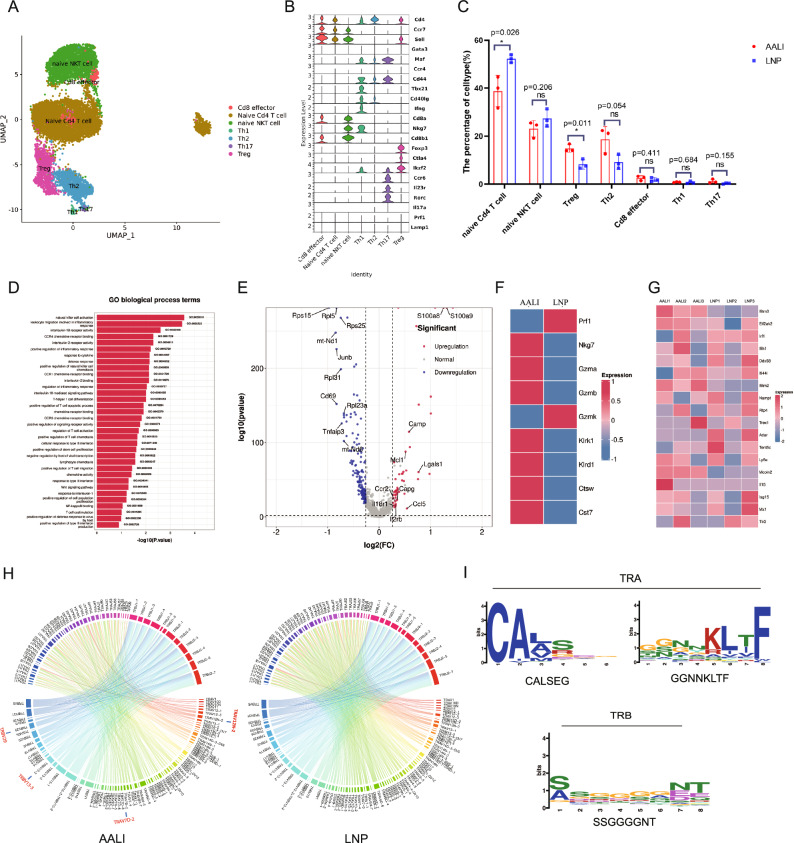
Monkeypox virus (MPXV) has re-emerged globally since May 2022, posing a significant public health threat. To address this, we develop two multivalent mRNA vaccine candidates-AAL, encoding three MPXV antigens, and AALI, which combines AAL with an immune-enhancing IFN-α protein. Both vaccines are delivered via mannose-modified lipid nanoparticles to target dendritic cells. Here we show that these vaccines elicit strong antibody responses against vaccinia virus and multiple MPXV clades, induce robust memory B-cell and T-cell responses, and promote dendritic cell maturation. In mouse challenge models, both vaccines provide protection against clade IIb MPXV and vaccinia virus, significantly reducing viral loads and preventing lung damage. Immune profiling reveals enhanced B- and T-cell receptor diversity and distinct CDR3 motifs post-vaccination. These findings demonstrate the potential of using mRNA-based multivalent vaccines as an effective strategy for preventing mpox and related Orthopoxvirus infections.


Conflict of interest statement

Competing interests: The authors S.C., S.Y.L., and L.W. have filed a Chinese patent application (number: 202410069336.7) for the MPXV mRNA vaccines and their construction method and application. The other authors do not claim competing interests.

Figures

Fig. 1
Fig. 1. Design, construction, and validation of MPXV mRNA vaccines.
A Two MPXV mRNAs encode fusion proteins: AALI (A35R, A29L, L1R, and IFN-α) and AAL (A35R, A29L, and L1R). mRNAs for IFN-α, RFP, and GFP were used as controls or markers. All sequences were codon optimized, fused with a signal peptide (SP), and inserted into the coding region. B Predicted 3D structures of the AALI and AAL fusion proteins: A29L (light green), A35R (red), L1R (blue), and IFN-α (cyan). C Characterization of LNPs and LNP-mRNA. TEM images of LNPs (left) and LNPs-mRNA (right); scale bar = 200 nm. D LNP (right) and LNPs-mRNA (left) particle sizes were measured via dynamic light scattering (DLS). E HeLa cells transfected with mRFP (RFP mRNA) or LNPs-mRFP were observed under a fluorescence microscope 24 h post-transfection. Images were captured at ×100 magnification. F In vivo bioluminescence imaging of mice 48 h after transfection with LNPs-mRFP. G HeLa cells were transfected with 2 μg of mRNA, and cell lysates collected at 24 h post-transfection were analyzed by SDS-PAGE and Western blotting with anti-A35R and anti-β-actin antibodies. Lane 1: markers; Lanes 2–4: LNPs-, AAL-, and AALI-treated groups. The red box indicates the target protein band. H, Microscopy images (×100) showing the growth status of HeLa cells (top) and RAW264.7 cells (bottom) treated with various LNPs concentrations. I The cell activity induced by LNPs was analyzed at 72 h. n = 3 biologically independent replicates. The data and error bars represent the means ± SDs. Statistical significance was calculated by one-way ANOVA with Tukey’s multiple comparison tests. *, p < 0.05; **, p < 0.01; ***, p < 0.001; ****, p < 0.001; ns, p > 0.05. J, K BMDCs were treated with AALI, AAL, IFN-α, LNPs, or PBS (control) for 48 h, then stained with antibodies against MHC I, MHC II, CD80, and CD86 for flow cytometry analysis. n = 3 biologically independent replicates. Data and error bars represent the means ± SDs. Statistical significance was calculated by one-way ANOVA with Tukey’s multiple comparison tests. *, p < 0.05; **, p < 0.01; ***, p < 0.001; ns, p > 0.05.
Fig. 2
Fig. 2. MPXV mRNA vaccines induce humoral immune responses.
AH The breadth of the total IgG antibody response elicited by the mRNA vaccine was determined by ELISAs of pooled antisera against clade IIb MPXV of A29L (A)-, A35R (B)-, and L1R (C)-, clade Ib MPXV of A29L (D)-, A35R (E)-, L1R (F)-, and VACV of A27L (G)- and A33R (H)-antigen proteins. All the data in (AH) are shown as the means ± SDs (n = 3 biologically independent replicates). I Fifty percent live-virus neutralizing antibody titers were determined by PRNT for clade II MPXV. n = 3 biologically independent replicates. The data are presented as the means ± SDs. JM Specific ASC responses to the A29L, AAL, and A35R proteins were measured with an ELISpot assay. J Frequencies of A29L-specific ASCs on days 0, 21, 35, 49 and 100. n = 3 biologically independent replicates. The data and error bars represent the means ± SDs. Statistical significance was calculated by one-way ANOVA with Tukey’s multiple comparison tests. *, p < 0.05; **, p < 0.01; ***, p < 0.001; ****, p < 0.0001; ns, p > 0.05. K, L, and M, Frequencies of AAL-, A29L- and A35R-specific ASCs on day 49. All the data and error bars in (KM) represent the means ± SDs (n = 3 biologically independent replicates). Statistical significance was calculated by one-way ANOVA with Tukey’s multiple comparison tests. *, p < 0.05; **, p < 0.01; ***, p < 0.001; ****, p < 0.0001; ns, p > 0.05.
Fig. 3
Fig. 3. Recombinant proteins induced CD4+ and CD8+ T-cell responses.
A Splenocytes isolated from immunized mice in each group on day 14 were examined by flow cytometry. The clusters of CD3+CD4+ and CD3+CD8+ cells represented the CD4+ (above) and CD8+ T cells (below). B Summary data for the fractions of CD4+ and CD8+ T cells in different groups. The data and error bars represent the means ± SDs (n = 3 biologically independent replicates). Statistical significance was calculated by one-way ANOVA with Tukey’s multiple comparison tests. *, p < 0.05; **, p < 0.01; ***, p < 0.001; ns, p > 0.05. C Splenocytes were plated in ELISpot wells, and IFN-γ and IL-4 cytokine-producing cells were detected. D Frequencies of IFN-γ- and IL-4 cytokine-producing cells on day 14. The data and error bars represent the means ± SDs (n = 3 biologically independent replicates). Statistical significance was calculated by one-way ANOVA with Tukey’s multiple comparison tests. *, p < 0.05; **, p < 0.01; ***, p < 0.001; ****, p < 0.0001; ns, p > 0.05. EI Production of cytokines, including IL-4, IL-6, IL-13, TNF-α, and IFN-γ, in the serum of patients treated with the mRNA vaccines. All the data and error bars in (EI) represent the means ± SDs (n = 3 biologically independent replicates). Statistical significance was calculated by one-way ANOVA with Tukey’s multiple comparison tests. *, p < 0.05; **, p < 0.01; ***, p < 0.001; ****, p < 0.0001; ns, p > 0.05. J Equal numbers of CFSEhigh-labeled A35R-pretreated cells and CFSElow-labeled BSA-pretreated splenocytes were mixed and injected into immunized mice. After 12 h, the splenocytes were collected to assess antigen-specific cytolytic responses using flow cytometry. K Infected cell-specific lysis in different groups. The data and error bars represent the means ± SDs (n = 3 biologically independent replicates). Statistical significance was calculated by one-way ANOVA with Tukey’s multiple comparison tests. *, p < 0.05; **, p < 0.01; ***, p < 0.001; ****, p < 0.0001; ns, p > 0.05.
Fig. 4
Fig. 4. Challenge test in BALB/c mice.
A Mice were infected intranasally with the clade II MPXV SZTH41, SZTH42 strains or VACV Tiantan strain 21 days after the third immunization. Created in BioRender. gN, \. (2025) https://biorender.com/k8huiqq. B The viral load in the lung was detected on days 4 and 7 post-infection via a focus-forming assay. n = 3 biologically independent mice. Data are presented as means ± SD. C The viral copy numbers of MPXV SZTH42 in the lungs, which were derived from the same batch of lung tissue samples as shown in (B), were quantified by qPCR. n = 3 biologically independent mice. The data are presented as the means ± SDs. D (clade II MPXV SZTH42 strain), E (clade II MPXV SZTH41 strain), and F (VACV Tiantan strain) depict the percentage change in body weight monitored 7–14 days post-challenge. For DF n = 6 biologically independent mice. G (clade II MPXV SZTH42 strain), H (clade II MPXV SZTH41 strain), and I (VACV Tiantan strain) present the survival curves of BALB/c mice following challenge. For GI n = 6 biologically independent mice. J Histopathology of lung tissue on day 7 post-infection with the MPXV clade II strain SZTH42 (scale bar = 200 μm). The green arrows indicate macrophage, lymphocyte, or granulocyte infiltration in alveolar spaces; the red arrows highlight alveolar hemorrhage; the yellow arrows denote peribronchial infiltration; and the black arrows indicate bronchial epithelial shedding. Untreated and unchallenged naive mice served as controls. K Distribution of MPXV (yellow for A35R), lung-infiltrating CD8+ T cells (green for CD8) and lung-infiltrating macrophages (red for F4/80); scale bar = 100 μm. L Relative quantification of the fluorescence intensity of A35R, CD8, and F4/80. n = 3 biologically independent replicates. The data and error bars represent the means ± SDs. Statistical significance was calculated by one-way ANOVA with Tukey’s multiple comparison tests. *, p < 0.5; **, p < 0.01; ***, p < 0.001; ns, p > 0.05.
Fig. 5
Fig. 5. Overall results of single-cell transcriptional profiling of splenocytes after vaccination.
A A schematic diagram of the overall study design. Splenocytes from AALI-treated (n = 3) and LNPs-treated mice (n = 3) were subjected to scRNA-seq gene expression profiling and TCR and BCR profiling analyses. Created in BioRender. gN, \. (2025) https://biorender.com/ac9szf7. B Cell populations were identified via UMAP projection, which revealed 11 major cell types across six samples. Each dot represents a single cell, colored according to its respective cell type. C Canonical cell markers were utilized to label clusters by cell identity in the UMAP plot, with data colored on the basis of expression levels via a log-scale legend. D Violin plots illustrating the expression distribution of selected canonical cell markers across 11 clusters, with rows representing marker genes and columns representing clusters. E Dot plot depicting cell type marker genes across 11 distinct cell types from spleen samples. F Average proportion of each cell type derived from the two groups. G Distribution of the average percentage of each immune cell type across the two conditions. n = 3 biologically independent replicates. The data and error bars represent the means ± SDs. Statistical significance was calculated by unpaired two-sided Student’s t-tests. *, p < 0.05; ns, p > 0.05.
Fig. 6
Fig. 6. Immunological features of B-cell subsets.
A UMAP projection of B cells, with each dot representing a single cell and colored by cell type. B Violin plots illustrating the expression distribution of selected canonical cell markers across six clusters, with rows representing marker genes and columns representing clusters. C Distribution of the average percentage of each immune cell type across the two groups. n = 3 biologically independent replicates. The data and error bars represent the means ± SDs. Statistical significance was calculated by unpaired two-sided Student’s t-tests. *, p < 0.05; **, p < 0.001; ns, p > 0.05. D GO terms are labeled with names and IDs and are sorted by −log10 p values. E Volcano plot showing the DEGs between the AALI- and LNPs-treated samples. DEGs refer to genes with a Benjamini‒Hochberg adjusted p value ≤ 0.05. F Bar plot showing the percentages of IGHA, IGHD, IGHG, and IGHM expression in the two groups. n = 3 biologically independent replicates. The data and error bars represent the means ± SDs. Statistical significance was calculated by unpaired two-sided Student’s t-tests. *, p < 0.05; **, p < 0.001; ns, p > 0.05. G Bar plot showing the percentages of IGHG1, IGHG2B, IGHG2C, and IGHG3 expression in the two groups. n = 3 biologically independent replicates. The data and error bars represent the means ± SDs. Statistical significance was calculated by unpaired two-sided Student’s t-tests. *, p < 0.05; **, p < 0.001; ns, p > 0.05. H UMAP plot showing BCR detection. I UMAP plot showing the BCR clone status distribution. J Stacked bar plots showing the multiclonal state of BCR in each sample. K Circos plots showing BCR chain rearrangements in the two groups. Arc lengths indicate VDJ gene family frequencies; colored ribbons represent paired segment usage. L The CDR3 motifs in the IGH, IGK, and IGL chains that are unique to the AALI-treated group were predicted after excluding sequences that were shared with the LNPs-treated group. The label on the x-axis represents the position of the CDR3 amino acid, and the y-axis represents the bits.
Fig. 7
Fig. 7. Immunological features of T-cell subsets.
A UMAP projection of T cells, with each dot representing a single cell and colored by cell type. B Violin plots depict the expression distribution of selected canonical cell markers across seven clusters, with marker genes in rows and clusters in columns. C Distribution of the average percentage of each immune cell type across the two groups. n = 3 biologically independent replicates. The data and error bars represent the means ± SDs. Statistical significance was calculated by unpaired two-sided Student’s t-tests. *, p < 0.05; **, p < 0.001; ns, p > 0.05. D GO terms are annotated with names and IDs, sorted by decreasing −log10 p values. DEGs denote genes with Benjamini‒Hochberg adjusted p values ≤ 0.05. E Volcano plot showing the DEGs between the AALI- and LNPs-treated samples. F Heatmap illustrating the expression of cytotoxic gene signatures in CD8+ T cells across the AALI- and LNPs-treated groups. The minimum signal is represented in blue, and the maximum signal is depicted in red. G Heatmap of the expression of the IFN response signature in T cells from all samples. The minimum signal is represented in blue, and the maximum signal is depicted in red. H Circos plots depicting the rearrangements of TCR chains in the two groups. Arc lengths reflect the relative frequency of VDJ gene families, whereas colored ribbons indicate the frequency of paired VDJ gene segments. I The CDR3 motifs for TRA and TRB chains that are unique to the AALI-treated group were predicted after sequences that were shared with the LNPs-treated group were excluded. The label on the x-axis represents the position of the CDR3 amino acid, and the y-axis represents the bits.

Similar articles

References

    1. Faye, O. et al. Genomic characterisation of human monkeypox virus in Nigeria. Lancet Infect. Dis.18, 246 (2018). - PMC - PubMed
    1. Shchelkunov, S. N. An increasing danger of zoonotic Orthopoxvirus infections. PLoS Pathog.9, e1003756 (2013). - PMC - PubMed
    1. Henderson, D. A. The eradication of smallpox–an overview of the past, present, and future. Vaccine29, D7–D9 (2011). - PubMed
    1. Shchelkunov, S. N. et al. Human monkeypox and smallpox viruses: genomic comparison. FEBS Lett.509, 66–70 (2001). - PMC - PubMed
    1. Nalca, A. & Zumbrun, E. E. ACAM2000: the new smallpox vaccine for United States Strategic National Stockpile. Drug Des. Dev. Ther.4, 71–79 (2010). - PMC - PubMed

MeSH terms

LinkOut - more resources