. 2025 Aug 9;16(1):7371.
doi: 10.1038/s41467-025-62601-4.

The South American MicroBiome Archive (saMBA): enriching the microbiome field by studying neglected populations

Affiliations

The South American MicroBiome Archive (saMBA): enriching the microbiome field by studying neglected populations

Benjamin Valderrama et al. Nat Commun. .

Abstract

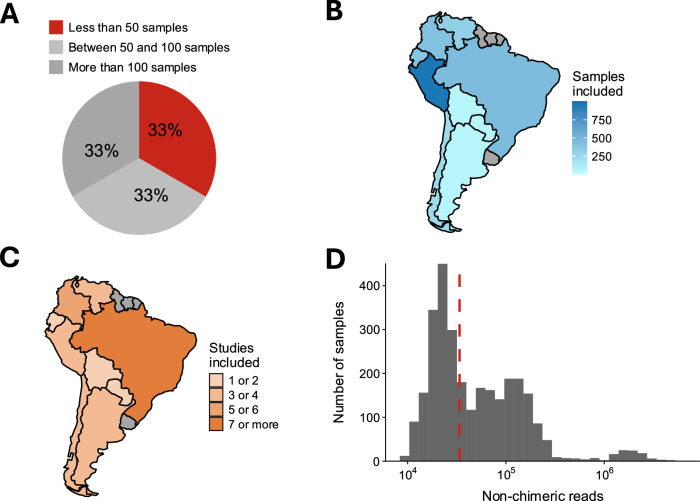
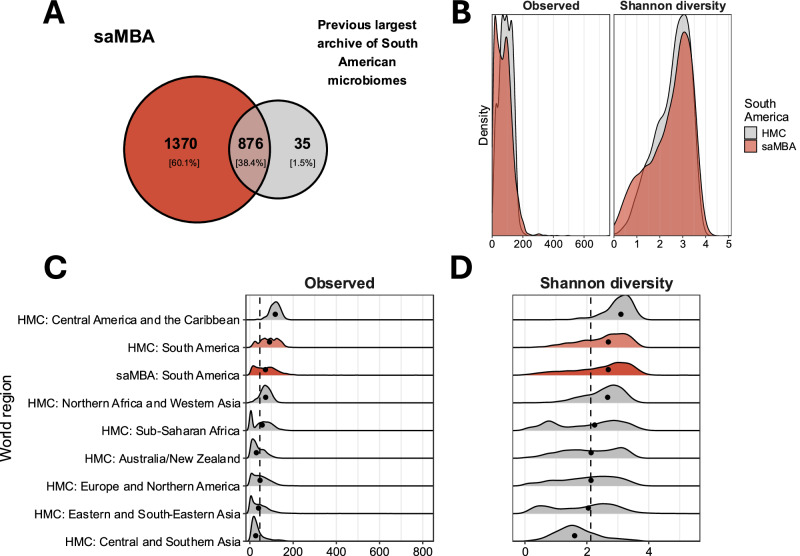
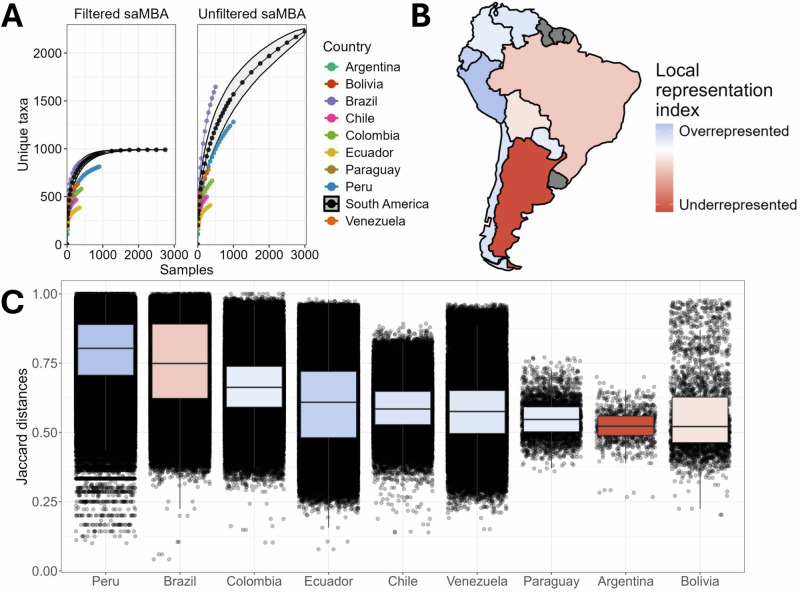
The human gut microbiome is associated with numerous health outcomes, often in a region-specific manner. Unfortunately, global microbiome research remains profoundly imbalanced: over 70% of sequenced human microbiomes originate from Europe and North America, which together represent only 15% of the world's population. To address this disparity, we developed saMBA-the largest archive of gut microbiomes from South America, one of the world's most microbiome-diverse regions but also among the least studied. The archive comprises 33 studies, ~73% of which had not been included in any previous compendium. A total of 3382 samples were reanalysed, of which 2913 were successfully included after applying quality filters. By leveraging this resource, we reveal both high within-population diversity and between-population uniqueness in the continent, expanding our current understanding of the gut microbiome to be more globally representative. Additionally, saMBA reveals that much of the region's gut microbiome diversity remains undercharacterised, and provides guidance for future sampling efforts to more accurately capture regional biodiversity. The framework used to build saMBA is compatible with existing global resources and is openly available, thus promoting the inclusion of other underrepresented populations to accelerate microbiome research globally.


Conflict of interest statement

Competing interests: J.F.C. has been an invited speaker at conferences organised by Bromotech, Yakult and Nestle and has received research funding from Nutricia, DuPont/IFF, and Nestle. G.C. has received honoraria from Janssen, Probi, Apsen, and Ingelheim Boehringer as an invited speaker; is in receipt of research funding from Pharmavite, Fonterra, Reckitt, Nestle and Tate and Lyle; and has been paid for consultancy work by Yakult, Zentiva, Bayer Healthcare and Heel Pharmaceuticals. This support neither influenced nor constrained the contents of this manuscript. The remaining authors declare no competing interests.

Figures

Fig. 1
Fig. 1. Overview of saMBA’s width across the South American continent.
A Percentage of studies including less than 50 samples (red), between 50 and 100 samples (light grey), and more than 100 samples (dark grey) across countries. B Number of samples included in saMBA from each South American country. Darker shades of blue indicate a higher number of samples, grey indicates countries without data. C Number of projects included in saMBA from each South American country. Darker shades of orange indicate a higher number of projects, grey indicates countries without data. D Number of non-chimeric reads detected in samples across all projects included in saMBA. The red dotted line represents the median of the distribution.
Fig. 2
Fig. 2. saMBA expands the number of identified bacterial taxa and shows a high degree of diversity across the continent.
A Venn diagram showing that saMBA (in red) covers most of the already identified genera in the region by a previous global compendium (HMC) (in grey) while more than doubles the current number of genera identified in the world region. B Density distributions of the number of observed genera (left) and Shannon diversity (right) indices for all South American samples included in the HMC (in grey) and saMBA (in red). C Distribution of the number of observed genera across world regions described in the HMC, and the new estimates generated in South America as compiled in saMBA. Black dots represent the median value for each region. The black dotted line shows the median value for the world. D Distribution of Shannon estimates of alpha diversity across world regions described in the previous global compendium (HMC), and the new estimates generated in South America as compiled in saMBA. Black dots represent the median value for each region. The black dotted line shows the median value for the world. In panels C and D, world regions other than South America are shown in grey. The distributions of the diversity indices calculated for South America are shown in pale red (when using data from the HMC), and in dark red (when using data from saMBA).
Fig. 3
Fig. 3. Biodiversity across the continent is likely underestimated, and future sampling efforts should consider biodiversity and uniqueness within each country.
A Number of unique taxa identified when subsampling an increasing number of samples from each country. Each dot represents the mean value of 1000 calculations of the number of unique taxa identified when subsampling at varying depths (i.e., number of samples). Each colour is a country. The grey area around the continental estimate (black line) represents the SD. The plot on the left was built after filtering taxa and samples as described in the methods section. The plot on the right was built without any filtering. B Map of the Local Representation Index (LRI). Blue represents countries where the proportion of microbiome samples is bigger than their share of the continental population. Orange shows the opposite. Grey indicates countries without data. C Boxplot and distribution of all Jaccard distances calculated using every pair of samples available for each country after filtering taxa and samples as described in “Methods”. The colours of the boxplot match the colour of the country given by its LRI.

Similar articles

References

    1. Joos, R. et al. Examining the healthy human microbiome concept. Nat. Rev. Microbiol.23, 192–205 (2025). - PubMed
    1. Hul, M. V. et al. What defines a healthy gut microbiome? Gut73, 1893–1908 (2024). - PMC - PubMed
    1. Hou, K. et al. Microbiota in health and diseases. Signal Transduct. Target. Ther.7, 1–28 (2022). - PMC - PubMed
    1. Maier, L. et al. Extensive impact of non-antibiotic drugs on human gut bacteria. Nature555, 623–628 (2018). - PMC - PubMed
    1. Gacesa, R. et al. Environmental factors shaping the gut microbiome in a Dutch population. Nature604, 732–739 (2022). - PubMed

LinkOut - more resources