. 2025 Aug 9;15(1):29164.
doi: 10.1038/s41598-025-13322-7.

Comprehensive multi-omics analysis reveals the core role of glycerophospholipid metabolism in the influence of short-chain fatty acids on the development of sepsis

Affiliations

Comprehensive multi-omics analysis reveals the core role of glycerophospholipid metabolism in the influence of short-chain fatty acids on the development of sepsis

Yunfen Tian et al. Sci Rep. .

Abstract

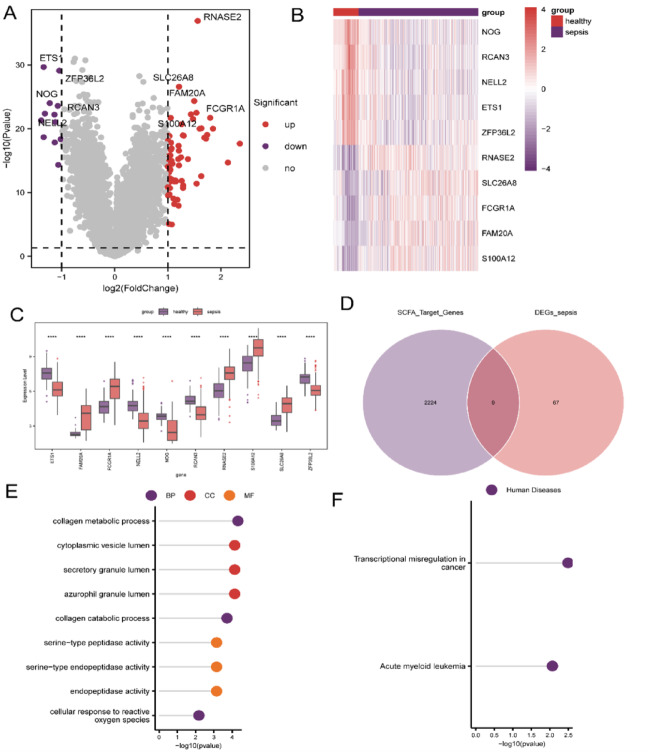
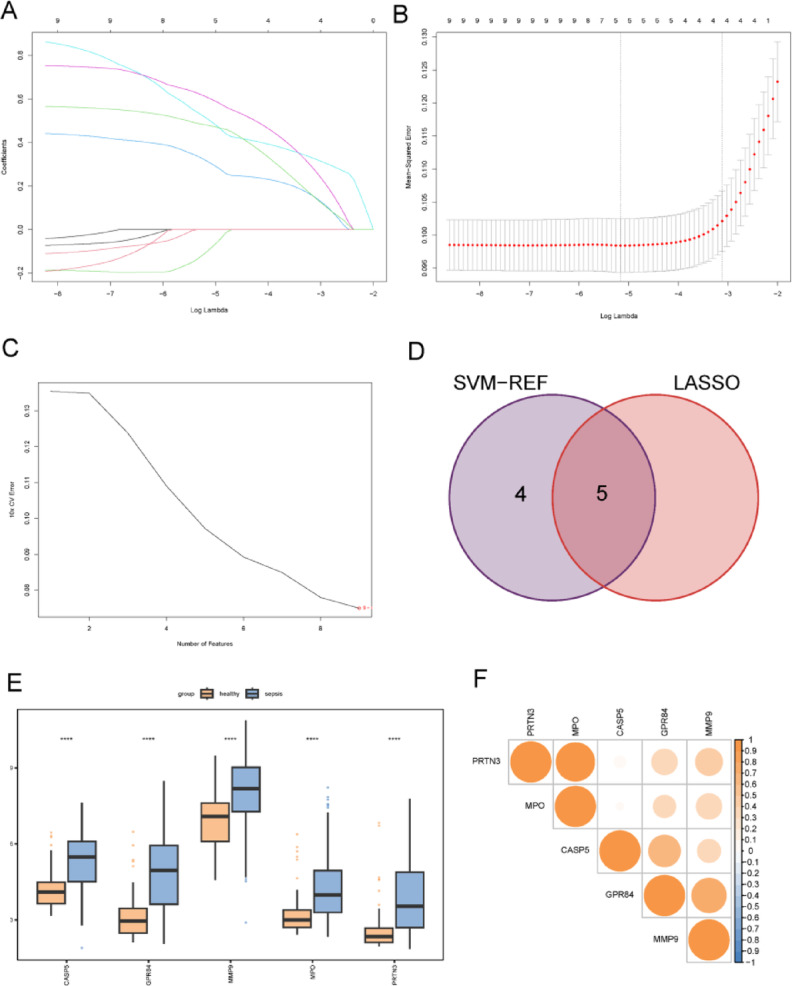
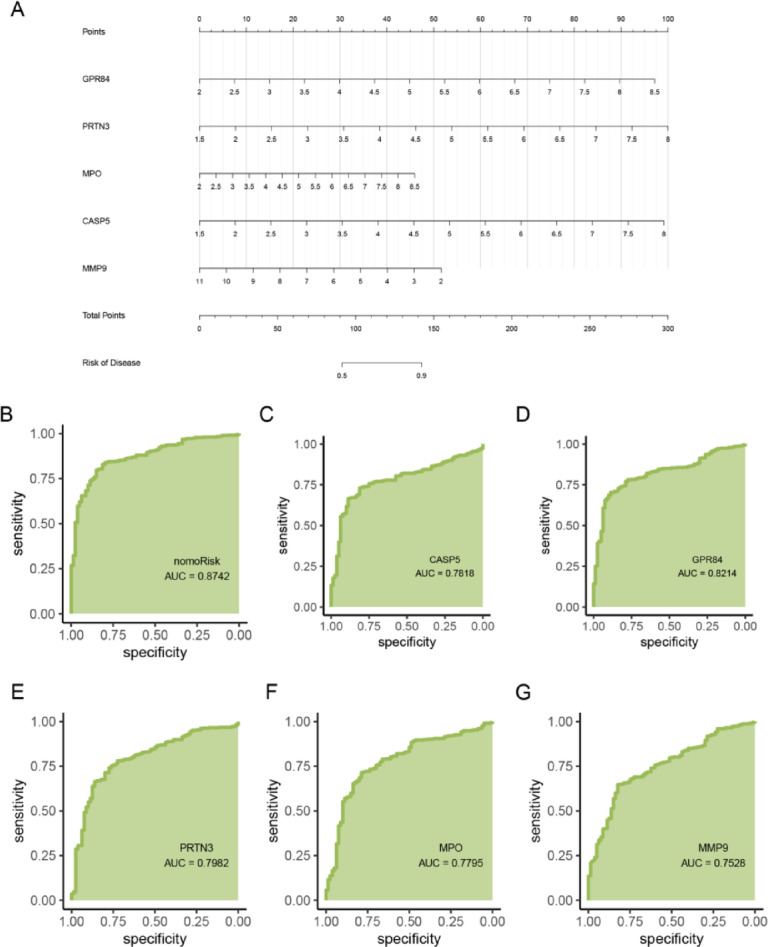
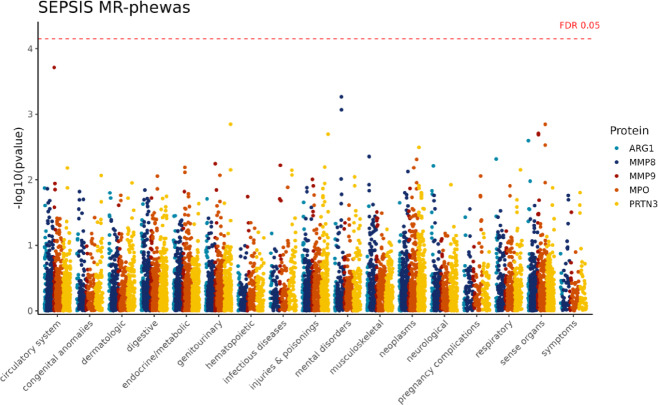
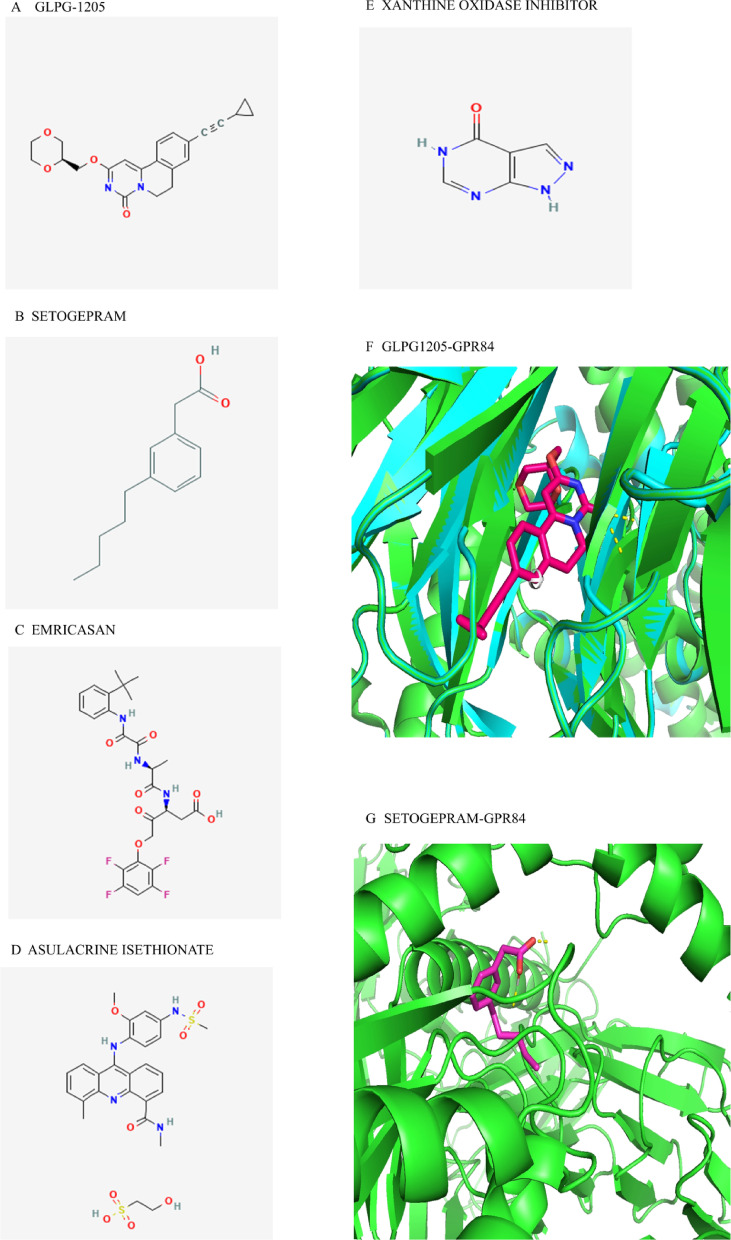
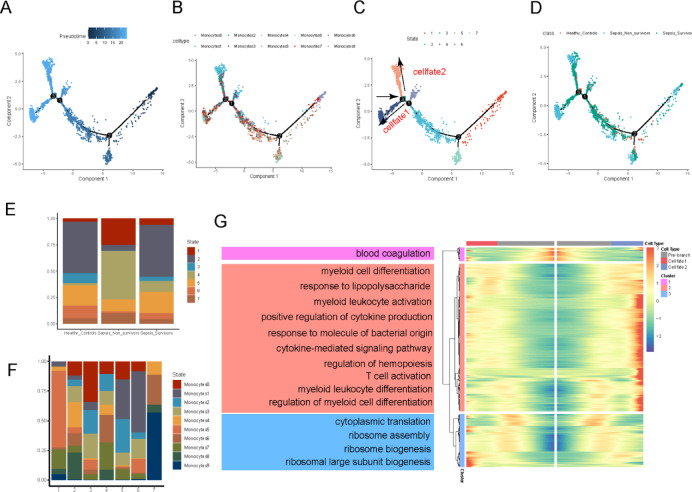
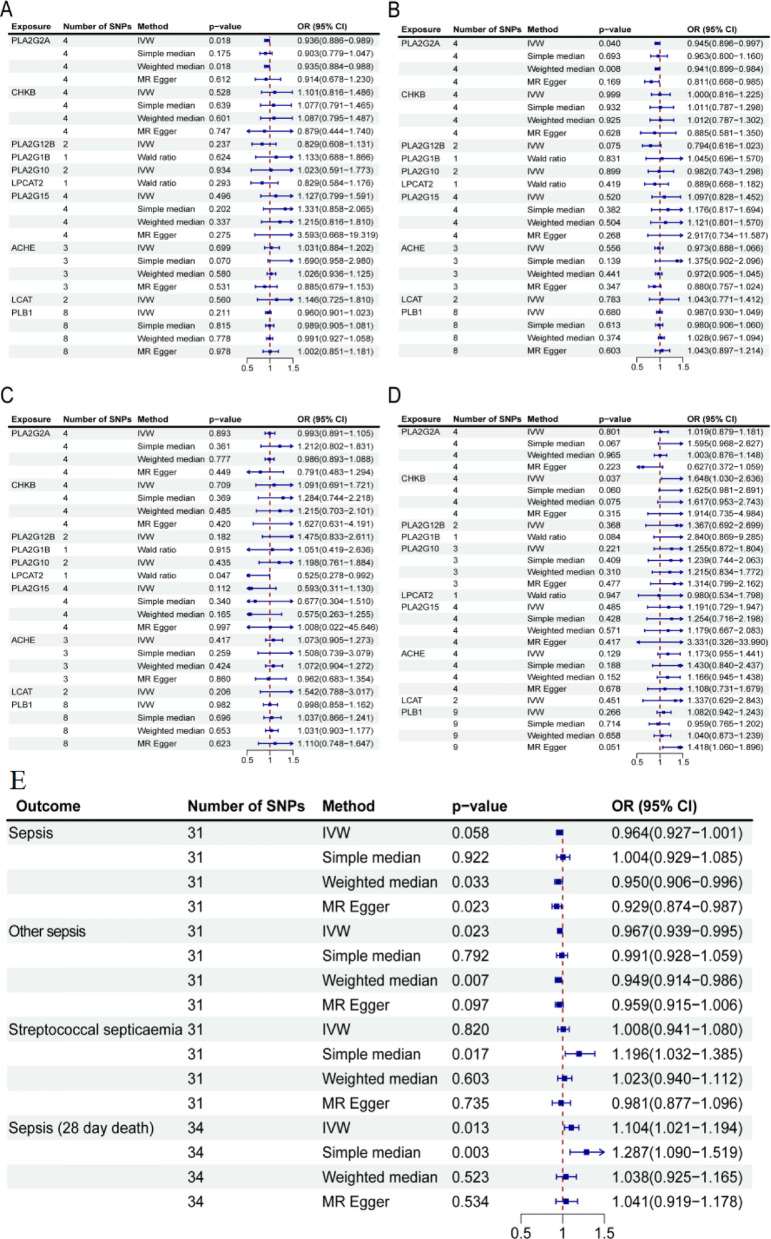
Sepsis is a systemic inflammatory response syndrome caused by infection, which has a high morbidity and mortality. Short-chain fatty acids (SCFAs) have been proved to improve the outcome of sepsis by regulating immunity and metabolism, but its specific mechanism is not clear. This study employed a multi-omics strategy integrating murine models, untargeted metabolomics, human transcriptomics (GSE185263, GSE54514), single-cell RNA sequencing (GSE167363), and Mendelian randomization to investigate SCFAs' role in sepsis. Cecal ligation and puncture (CLP) was performed in C57BL/6 mice (n = 60). Transcriptomic analysis identified 76 differentially expressed genes between septic and healthy subjects. Machine learning (SVM-RFE and LASSO regression) prioritized five SCFA-associated hub genes (CASP5, GPR84, MMP9, MPO, PRTN3), with molecular docking revealing two potential modulators. Single-cell profiling localized these targets to monocytes, while immune infiltration analysis confirmed SCFA-mediated immunomodulation. Murine metabolomics identified glycerophospholipid (GPL) metabolism as the most significantly altered pathway under SCFAs intervention. Mendelian randomization established causal relationships between GPL pathway genes and sepsis incidence/28-day mortality. Collectively, the study provide novel mechanistic and translational insights into the therapeutic targeting of short-chain fatty acids in sepsis.

Keywords: Glycerophospholipid metabolism; Multi-omics; Sepsis; Short chain fatty acids.


Conflict of interest statement

Declarations. Ethical approval and consent to participate: The following information was supplied relating to ethical approvals (i.e., approving body and any reference numbers): Ethics Committee of Guizhou Provincial People’s Hospital (Approval NO. EC Review 2023–003). Consent for publication: Not applicable. Competing interests: The authors declare no competing interests.

Figures

Fig. 1
Fig. 1
Screening of key genes in the transcriptome. (a) Volcano plot of significantly differentially expressed genes in the sepsis and control groups in the transcriptome data, with red representing genes significantly up-regulated in sepsis and purple representing genes significantly down-regulated in sepsis. (b) Differential gene analysis of transcriptome data for TOP5 in up- and down-regulation. (c) Relative expression of TOP5 differential genes in up- and down-regulation, asterisks represent p-values: ****p < 0.0001, ***p < 0.001, **p < 0.01, *p < 0.05. (d) Intersecting Venn diagrams of conventional transcriptome differential genes and SCFA-related genes. (e) Graph of GO enrichment results for key genes, showing the top 3 pathways with the highest significance in BP, CC, and MF. (f) Display of the enrichment results for KEGG pathways of key genes.
Fig. 2
Fig. 2
Selection of candidate diagnostic biomarkers for sepsis disease progression using machine learning methods. (a) LASSO regression of the trajectories of the independent variables, with the horizontal coordinate indicating the logarithm of the lambda of the independent variables and the vertical coordinate indicating the independently accessible coefficients, dashed vertical line indicates optimal λ where 5 features remain. (b) Ten-fold cross-validation for LASSO regression. Error bars represent mean ± SD MSE. Dotted vertical line marks λ yielding minimal cross-validation error. (c) SVM-RFE feature optimization: The horizontal axis is the number of features, the vertical axis is the classification accuracy, and the red mark is the most characteristic number. Blue line tracks tenfold cross-validation error rate; red dot indicates optimal feature number (9 genes) achieving minimal classification error. (d) Venn diagram showing the intersection of LASSO regression and SVM-RFE algorithm. (e) Box line plots of the expression of the 5 key genes in the sepsis group and the control group. (f) Heatmap of correlation between the 5 key genes.
Fig. 3
Fig. 3
Construction and validation of Sepsis diagnostic column-line diagram model. (a) Column-line diagrams were used to predict the occurrence of Sepsis. (b) ROC curves assessed the clinical value of the column-line diagram model. (c) ROC curve of CASP5. (d) ROC curve of GPR84. (e) ROC curve for PRTN3. (f) ROC curve of MPO. (g) ROC curve of MMP9.
Fig. 4
Fig. 4
Manhattan plot of Phenome-wide MR results: ARG1, MMP8, MMP9, MPO and PRTN3 Note: In Phenome-wide MR results, the vertical coordinate represents the p-value. A dot represents a disease feature, and different colors represent differently expressed MR results.
Fig. 5
Fig. 5
The difference in immune infiltration of key genes. (a) The difference in estimated infiltration ratio of immune cells between the Sepsis and control group. The asterisk represents the p value: * * * p < 0.0001, * * p < 0.001, * * p < 0.01, * * p < 0.05. (b) Correlation between CASP5 and Type 17 helper cells. (c) the correlation between casp5 and Neutrophil. (d) correlation between casp5 and Eosinophil. (e) correlation between CASP5 and activated dendritic cells. (f) Correlation between GPR84 and Central memory CD4T cell. (g) correlation between GPR84 and Immature B cells. (h) Correlation between GPR84 and Type17 helper-cells. (i) Correlation between MPO and Master cell. (j) Correlation between MMP9 and central memory CD4T cell.
Fig. 6
Fig. 6
Regulatory network of Hub genes. (a) mRNA-miRNA-lncRNA interaction network, orange circle is mRNA; blue circle is miRNA; green circle is lncRNA. (b) mRNA-RBP interaction network, orange squares are mRNA; blue squares are RBP. (c) mRNA-TF interaction network, orange circles are mRNAs; blue circles are transcription factors (TFs).
Fig. 7
Fig. 7
The two-dimensional structure of small molecule drugs predicted by key genes, and the results of drug structural formula and molecular docking. (a) GLPG-1205. (b) SETOGEPRAM. (c) EMRICASAN. (d) ASULACRINE ISETHIONATE. (e) XANTHINE OXIDASE INHIBITOR. (f) GLPL1205-GPR84. (g) SETOGEPRAM-GPR84.
Fig. 8
Fig. 8
Identification of cell types from single-cell sequencing data. (a) UMAP plot showing the distribution of clustering results for cells. (b) UMAP plot showing the annotation results of cells. (c) Heatmap showing cell cluster-specific expressed genes. (d) Cumulative histogram showing the percentage of different cell types in each sample and between each group. (e) Expression of marker genes in each cell type.
Fig. 9
Fig. 9
Accurate localization of key gene sets in Monocytes. (a) Heatmap demonstrating the enrichment of the key gene set in all cell types. (b) UMAP plot demonstrating the reclustering of Monocytes cells into 10 Clusters. (c) Enrichment of key gene sets in all subpopulations of Monocytes. (d) Heatmap demonstrating the top 5 differentially expressed genes in Monocytes subpopulations. (e) Heatmap demonstrating the top 3 pathways most significantly differentially enriched in Monocytes1 versus other Monocytes subpopulations.
Fig. 10
Fig. 10
Transcriptional trajectory analysis reveals Sepsis transcriptional patterns. (a–d) Proposed temporal trajectories showing the distribution of Monocytes cells based on differentiation time, cell type, different states and grouping. (e) Stacked histograms demonstrating the distribution of transcriptional states in different subgroups. (f) Stacked histogram showing the distribution of cell types in different states. (g) Heatmap showing DEGs in different branches (cell fate). GO pathways significantly enriched in different gene clusters in the heatmap are shown on the left.
Fig. 11
Fig. 11
Correlation analysis between glycerophospholipid metabolism and diagnostic genes. (a) Differential metabolite enrichment results of CLP vs Control, CS vs Control, and CS vs CLP. (b) Expression levels glycerophospholipid metabolism distribution between sepsis patients and normal individuals. (c) Correlation analysis between the expression levels of CASP5 and glycerophospholipid metabolism. (d) Correlation analysis between the expression levels of GPR84 and glycerophospholipid metabolism. (e) Correlation analysis between the expression levels of PRTN3 and glycerophospholipid metabolism. (f) Correlation analysis between MPO and glycerophospholipid metabolism. (g) Correlation analysis between MMP9 and glycerophospholipid metabolism.
Fig. 12
Fig. 12
Mendelian Randomized analysis between Diagnostic Genes、 Glycerol-phospholipid metabolic pathway and Sepsis. (a) Mendelian Randomized analysis between Diagnostic Genes and Sepsis. (b) Mendelian Randomized analysis between Diagnostic Genes and Other Sepsis. (c) Mendelian Randomized analysis between Diagnostic Genes and Streptococcal septicemia. (d) Mendelian Randomized Analysis between Diagnostic Genes and Sepsis (28-day-death). (e) Mendelian Randomized analysis between glycerophospholipid metabolism pathway and Sepsis.

Similar articles

References

    1. Evans. L., Rhodes, A., Alhazzani, W., et al. Surviving sepsis campaign: international guidelines for management of sepsis and septic shock 2021[J]. Intensive Care Medicine. 47(11), 1181–1247 (2021). - PMC - PubMed
    1. Huang, N., Wei, Y. & Wang, M. Dachaihu decoction alleviates septic intestinal epithelial barrier disruption via PI3K/AKT pathway based on transcriptomics and network pharmacology. J. Ethnopharmacol.337, 118937 (2025). - PubMed
    1. Dulhunty, J. M. et al. Continuous vs intermittent β-lactam antibiotic infusions in critically ill patients with sepsis: The BLING III randomized clinical trial. JAMA332(8), 629 (2024). - PMC - PubMed
    1. Morrison, D. J. & Preston, T. Formation of short chain fatty acids by the gut microbiota and their impact on human Metabolism. Gut Microb.7(3), 189–200 (2016). - PMC - PubMed
    1. Yao, Y. et al. Short chain fatty acids: Essential weapons of traditional medicine in treating inflammatory bowel disease. Molecules29(2), 379 (2024). - PMC - PubMed