. 2025 Aug 9;22(1):202.
doi: 10.1186/s12974-025-03523-2.

Inhibition of astrocyte signaling leads to sex-specific changes in microglia phenotypes in a diet-based model of cerebral small vessel disease

Affiliations

Inhibition of astrocyte signaling leads to sex-specific changes in microglia phenotypes in a diet-based model of cerebral small vessel disease

Jenna L Gollihue et al. J Neuroinflammation. .

Abstract

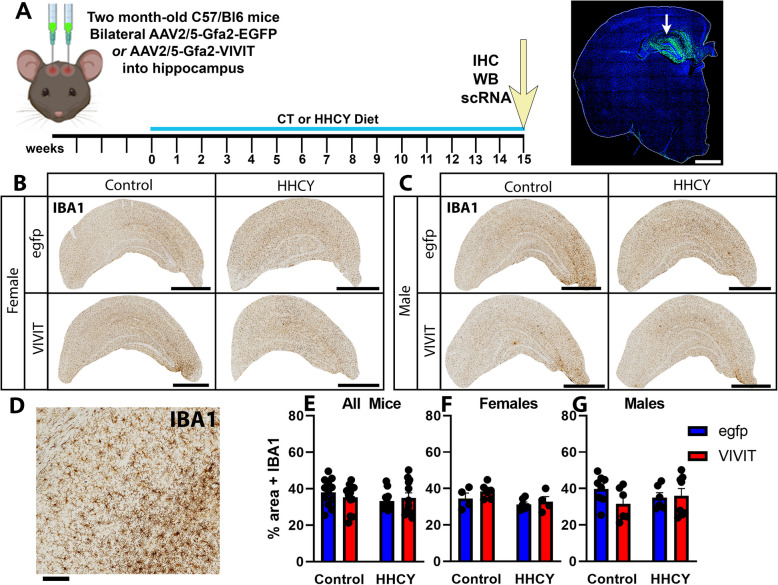
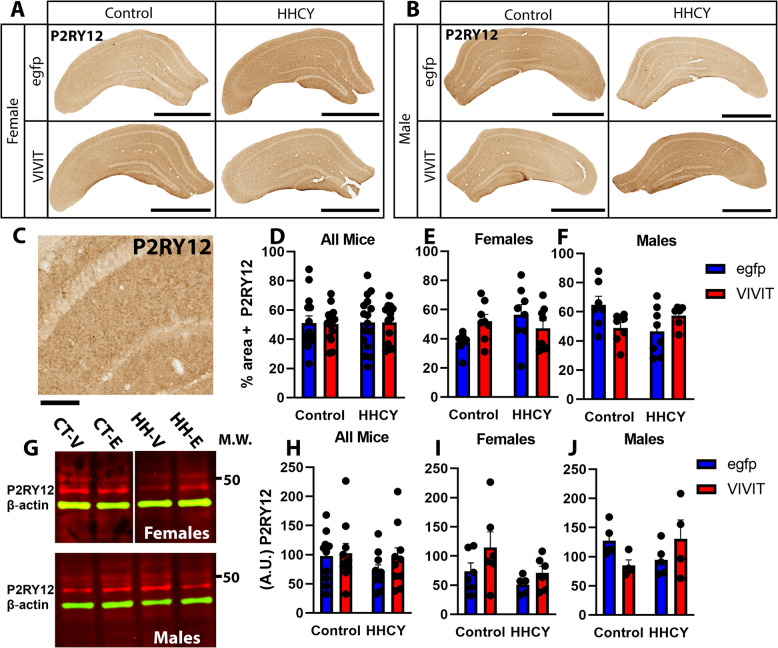
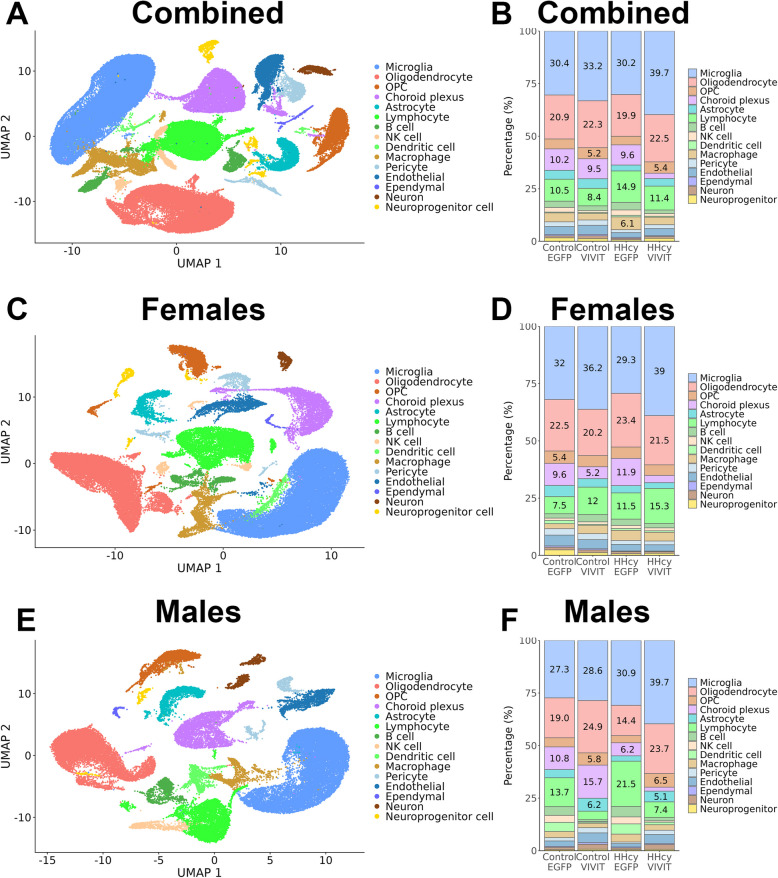
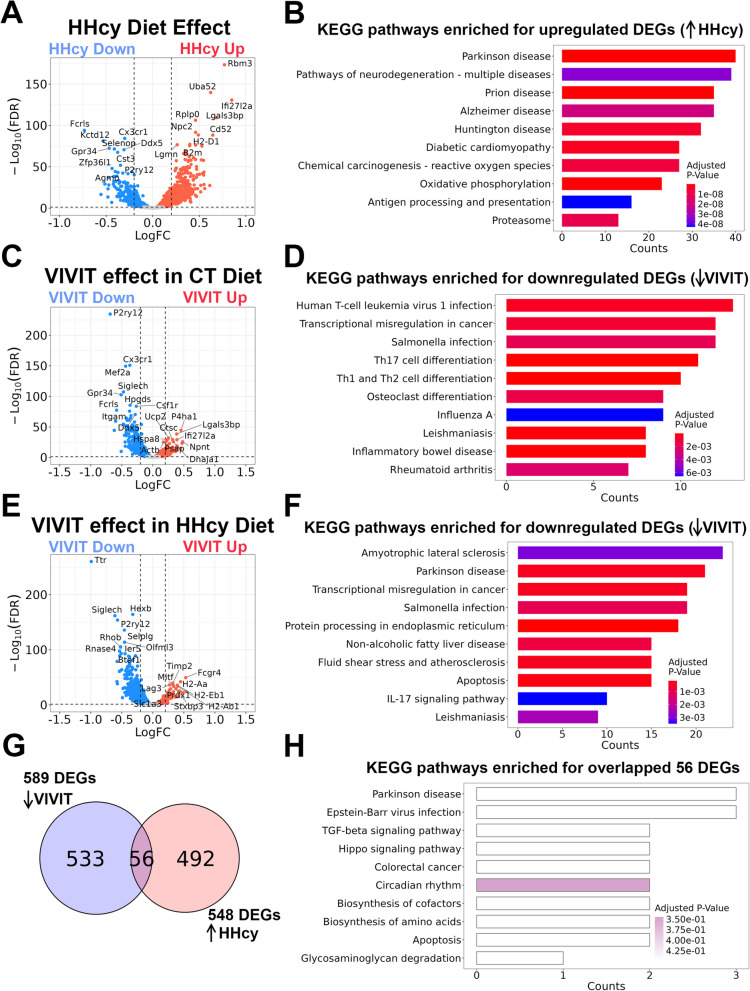
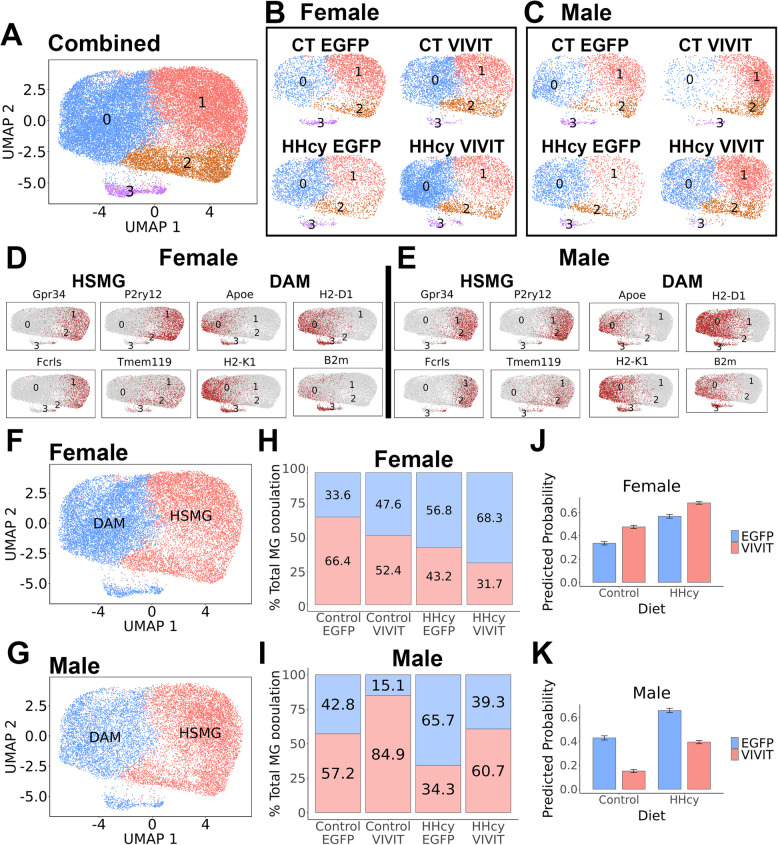
Hyperhomocysteinemia (HHcy)-inducing diets recapitulate cerebral small vessel disease phenotypes in mice including cerebrovascular pathology/dysfunction, neuroinflammation, synaptic deficits, and cognitive decline. We recently showed that astrocyte signaling through calcineurin(CN)/nuclear factor of activated T cells (NFATs) plays a causative role in these phenotypes. Here, we assessed the impact of astrocytic signaling on microglia, which set the inflammatory tone in brain. Seven-to-eight-week-old male and female C57BL/6 J mice received intrahippocampal injections of adeno-associated virus (AAV) expressing EGFP (AAV2/5-Gfa2-EGFP) or AAV expressing the NFAT inhibitor VIVIT (i.e., AAV2/5-Gfa2-VIVIT-EGFP). Mice were then fed with control chow (CT) or B-vitamin-deficient chow for 12 weeks to induce HHcy. Immunohistochemistry and Western blot analyses suggested that expression of the homeostatic microglial marker, P2RY12, responded differently to AAV treatments depending on diet and sex. We next conducted single-cell RNA sequencing (scRNA-seq) to determine if microglial genes and/or clustering patterns were differentially sensitive to diet and AAV, depending on sex. In males, disease-associated microglial genes and subclusters were overrepresented in HHcy-treated mice, while VIVIT promoted the appearance of homeostatic microglial genes and clusters. In contrast, microglial genes in females were less sensitive to diet and AAV treatments, though disease-like patterns were also observed in the HHcy condition. Very few of the HHcy-sensitive microglial genes in females were affected by VIVIT. Though based on small sample sizes, the results suggest a sexually dimorphic influence of astrocyte signaling on microglial transcriptional phenotypes in the context of HHcy and small cerebral vessel disease. However, these interpretations will need to be bolstered with additional biological replicates and more stringent statistical analyses.

Keywords: Astrocyte reactivity; Calcium; Microglia; Neuroinflammation; Vascular.


Conflict of interest statement

Declarations. Ethics approval and consent to participate: All animal procedures were conducted in accordance with the National Institutes of Health Guide for the Care and Use of Laboratory Animals and were approved by University of Kentucky Institutional Animal Care and Use Committees. Consent for publication: NA. Competing interests: The authors declare no competing interests.

Figures

Fig. 1
Fig. 1
HHcy diet and VIVIT treatments have little effect on IBA1 protein expression in microglia. A, time-line of diet and AAV treatments. Male and female Mice received bilateral hippocampal injections of AAV vectors at approximately two months of age. The low magnification (calibration bar is 1 mm) photomicrograph on the right shows isolated EGFP expression throughout the hippocampus (white arrow), per our previous studies [, –19]. One month following AAV injection, mice were started on a control (CT) diet or a HHcy inducing diet. At 12–15 weeks of diet treatment, mice were harvested and brains were sectioned for immunohistochemical (IHC) labeling, Western blot (WB) or scRNA-seq analyses. B-C, Representative photomicrographs of IBA1 immunolabeling in hippocampus across the four diet/AAV conditions in female (B) and male (C) mice. calibration bar is 1 mm. D, IBA1 immunolabeling photomicrograph at higher magnification. calibration bar is 100 µm. E–G, % area occupied by IBA1 immunolabel across all mice (E), only females (F), or only males (G)
Fig. 2
Fig. 2
HHcy diet and VIVIT treatments have differential effects on P2RY12 protein expression in males and females. A-B, low magnification photomicrographs of P2RY12 immunolabeling in hippocampus across the four diet/AAV conditions in female (A) and male (B) mice. Calibration bar is 1 mm. C, P2RY12 immunolabeling photomicrograph at higher magnification. calibration bar is 100 µm. D-F, % area occupied by P2RY12 immunolabel across all mice (D), only females (E), or only males (F). Each plot symbol represents an individual immunolabeled section (one-two sections per mouse). G, Representative Western blots showing the expression of P2RY12 (red band at approximately 45 kDA) and β-actin loading control (green band, around 40 kDa) in females (top) and males (bottom) across diet and AAV treatment conditions (CT-E = CT EGFP, CT-V = CT VIVIT, HH-E = HHcy EGFP, HH-V = HHcy VIVIT). H-J, P2RY12 expression (arbitrary units, A.U. via Western blot) across all mice (H), only females (I), or only males (J). Each plot symbol represents an individual mouse. For both immunohistochemical and Western analyses, HHcy and VIVIT had differential effects on P2RY12 expression in males and females (determined by a mixed effects model)
Fig. 3
Fig. 3
Cell clusters in males, females, and combined sexes based on canonical gene expression markers. A, UMAP constructed from integrated male (n = 4) and female (n = 4) groups revealed 15 cell clusters based on the expression of canonical cellular markers (see Supplementary Fig. 1). B, Each cluster (shown in panel A) expressed as a percentage of the total cell count. C-F, UMAPs and the proportional contributions of cell clusters to the total cell count in females (C and D) and males (E and F)
Fig. 4
Fig. 4
Differentially expressed microglial genes and KEGG pathway mapping in females. A, Volcano plot shows microglial DEGs that are upregulated (HHcy Up, red) and downregulated (HHcy Down, blue) in the HHcy-EGFP vs CT EGFP treatment conditions. B, KEGG pathways enriched for HHcy-sensitive (upregulated) DEGs. C, Volcano plot shows microglial DEGs that are upregulated (VIVIT Up, red) and downregulated (VIVIT Down, blue) by VIVIT in the CT-EGFP vs CT VIVIT treatment conditions. D, KEGG pathways enriched for VIVIT-sensitive (downregulated) DEGs in the CT EGFP vs CT VIVIT conditions. E, Volcano plot shows microglial DEGs that are upregulated (VIVIT Up, red) and downregulated (VIVIT Down, blue) by VIVIT in the HHcy-EGFP vs HHcy VIVIT treatment conditions. F, KEGG pathways enriched for VIVIT-sensitive (downregulated) DEGs in the HHcy EGFP vs HHcy VIVIT conditions. G, Venn diagrams showing DEGs that are sensitive to both HHcy (589 genes upregulated in HHcy EGFP vs CT EGFP comparison) and VIVIT (548 genes downregulated in HHcy VIVIT vs HHcy EGFP). Very little overlap (56 genes) was observed for HHcy and VIVIT sensitive genes. The statistical significance of the overlap was assessed using Fisher’s exact test implemented via the GeneOverlap R package. The observed overlap of 56 genes is not statistically significant (p > 0.99; odds ratio = 0.72). For all measures, data were pooled from two replicates (two mice) per treatment group
Fig. 5
Fig. 5
Differentially expressed microglial genes and KEGG pathway mapping in males. A, Volcano plot shows microglial DEGs that are upregulated (HHcy Up, red) and downregulated (HHcy Down, blue) in the HHcy-EGFP vs CT EGFP treatment conditions. B, KEGG pathways enriched for HHcy-sensitive (upregulated) DEGs. C, Volcano plot shows microglial DEGs that are upregulated (VIVIT Up, red) and downregulated (VIVIT Down, blue) by VIVIT in the CT-EGFP vs CT VIVIT treatment conditions. D, KEGG pathways enriched for VIVIT-sensitive (downregulated) DEGs in the CT EGFP vs CT VIVIT conditions. E, Volcano plot shows microglial DEGs that are upregulated (VIVIT Up, red) and downregulated (VIVIT Down, blue) by VIVIT in the HHcy-EGFP vs HHcy VIVIT treatment conditions. F, KEGG pathways enriched for VIVIT-sensitive (downregulated) DEGs in the HHcy EGFP vs HHcy VIVIT conditions. G, Venn diagrams showing DEGs that are sensitive to both HHcy (872 genes upregulated in HHcy EGFP vs CT EGFP comparison) and VIVIT (2233 genes downregulated in HHcy VIVIT vs HHcy EGFP). More than 90% of the HHcy sensitive genes (773 genes) were also sensitive to VIVIT treatment. The statistical significance of the overlap was assessed using Fisher’s exact test implemented via the GeneOverlap R package. The observed overlap of 773 genes is significantly enriched (p < 8.5 × 10–142; odds ratio = 10.27). For all measures, data were pooled from two replicates (two mice) per treatment group
Fig. 6
Fig. 6
Sex dependent effects on microglial subclusters as a function of diet and AAV treatment. A, UMAP showing four distinct microglia clusters across diet and AAV conditions for males and females, combined. B-C, UMAPs for females (B) and males as a function of diet and AAV treatment. D-E, Expression of common HSMG (Gpr34, P2ry12, Fcrls, and Tmem119) and DAM markers (Apoe, H2-D1, H2-K1, and B2m) across the entire microglial cluster in females (D) and males (E). F-G, Clusters were collapsed into two categories (HSMG and DAM) for females (F) and males (G) based on the distribution of cellular markers in D and E. H-I, Proportions of HSMG and DAM clusters (% total microglial (MG) population) across the diet and AAV treatment conditions in females (H) and males (I). J-K, Predicted probabilities of DAM identity across diet and AAV treatment in females (J) and males (K) based on the logistic regression model accounting for interactions between sex, diet, and treatment. Bars show estimated probabilities and 95% confidence intervals, highlighting sex-dependent differences in microglial responses to treatment and dietary conditions (also see Supplementary Table 11)

Update of

Similar articles

References

    1. Alber J, Alladi S, Bae HJ, Barton DA, Beckett LA, Bell JM, Berman SE, Biessels GJ, Black SE, Bos I, et al. White matter hyperintensities in vascular contributions to cognitive impairment and dementia (VCID): Knowledge gaps and opportunities. Alzheimers Dement (N Y). 2019;5:107–17. - PMC - PubMed
    1. Dupre N, Drieu A, Joutel A. Pathophysiology of cerebral small vessel disease: a journey through recent discoveries. J Clin Invest. 2024;134:e172841. - PMC - PubMed
    1. Snyder HM, Corriveau RA, Craft S, Faber JE, Greenberg SM, Knopman D, Lamb BT, Montine TJ, Nedergaard M, Schaffer CB, et al. Vascular contributions to cognitive impairment and dementia including Alzheimer’s disease. Alzheimers Dement. 2015;11:710–7. - PMC - PubMed
    1. Carey A, Fossati S. Hypertension and hyperhomocysteinemia as modifiable risk factors for Alzheimer’s disease and dementia: New evidence, potential therapeutic strategies, and biomarkers. Alzheimers Dement. 2023;19:671–95. - PMC - PubMed
    1. Price BR, Wilcock DM, Weekman EM. Hyperhomocysteinemia as a risk factor for vascular contributions to cognitive impairment and dementia. Front Aging Neurosci. 2018;10:350. - PMC - PubMed

LinkOut - more resources