. 2025 Aug 9;16(1):7345.
doi: 10.1038/s41467-025-62685-y.

Cell free RNA detection of pancreatic cancer in pre diagnostic high risk and symptomatic patients

Affiliations

Cell free RNA detection of pancreatic cancer in pre diagnostic high risk and symptomatic patients

Travis W Moore et al. Nat Commun. .

Abstract

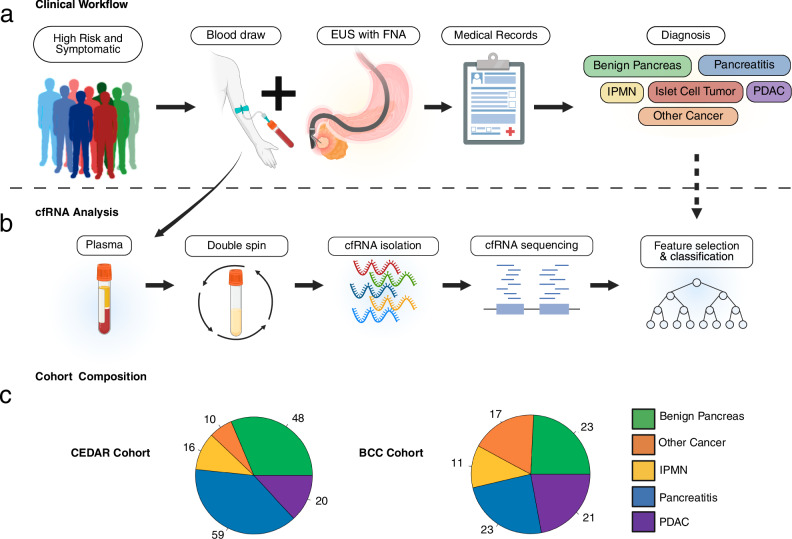
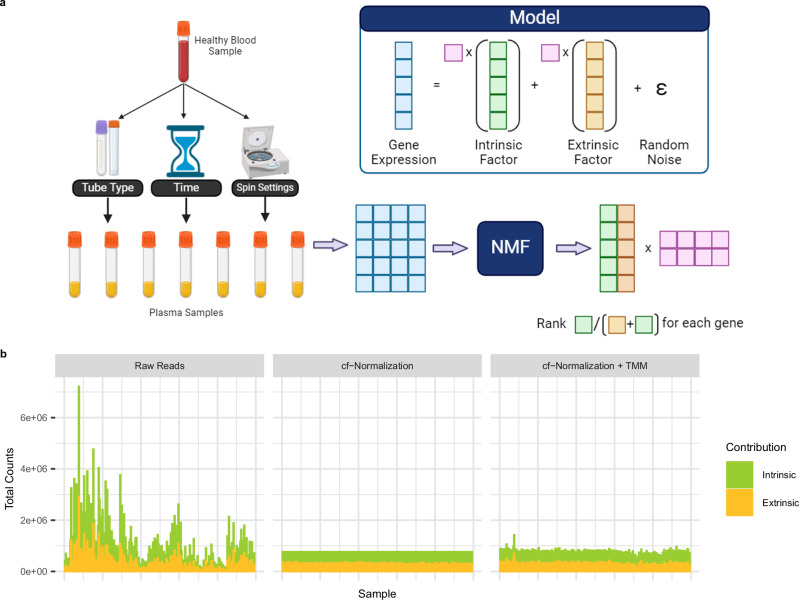
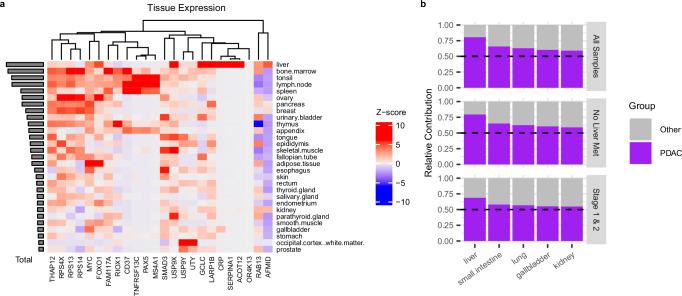
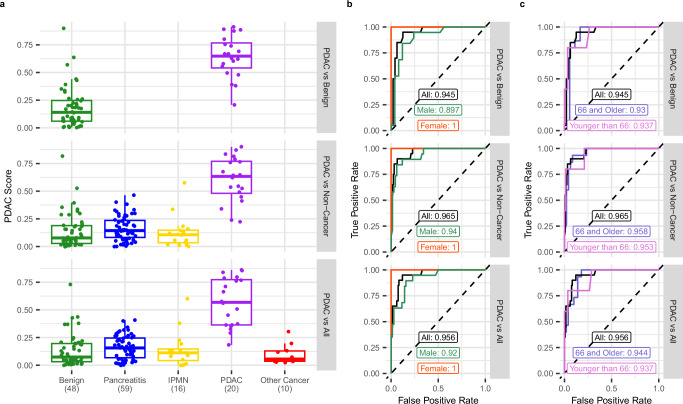
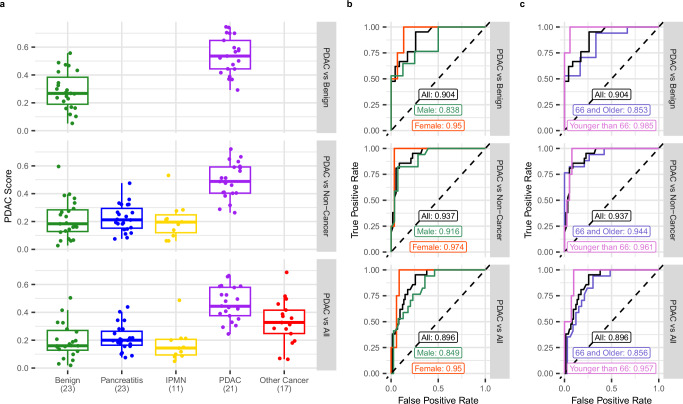
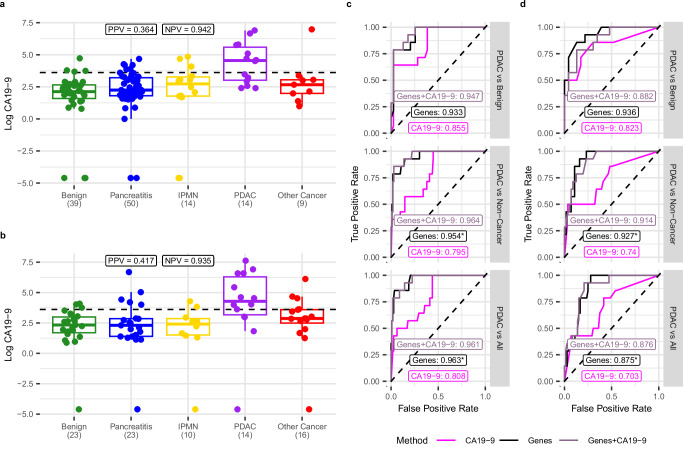
Pancreatic ductal adenocarcinomas (PDAC) are among the most fatal cancers, in part due to frequent detection at advanced stages. Endoscopic ultrasound-guided fine-needle aspiration (EUS-FNA), the most sensitive diagnostic method of PDAC in current standard clinical practice, is invasive, costly, with access limited to major healthcare settings. Here, we present a non-invasive evaluation of plasma cell-free RNA (cfRNA) for PDAC detection in pre-diagnostic high-risk and de novo symptomatic patients presenting for EUS-FNA. We develop a cfRNA normalization method to account for preanalytical variation and handling effects and derive 29 potential cfRNA biomarkers for PDAC diagnosis using 153 samples collected prior to the EUS procedure. Biomarkers related to liver function are elevated in PDAC samples, including early-stage patients without liver metastasis. Classification of PDAC using these biomarkers is validated using an independent cohort of 95 samples. Our findings could help to improve diagnostic utility in high-risk and symptomatic individuals.


Conflict of interest statement

Competing interests: The authors declare no competing interests.

Figures

Fig. 1
Fig. 1. Overview of the study design.
a High-risk and symptomatic patients who were referred to an EUS procedure were recruited. Blood draws were performed before the procedure. The final annotation by a board-certified physician on the team, based on a full charge review after more than 1 year from blood collection, categorizes patients into 5 groups: benign pancreas, pancreatitis, IPMN, PDAC, and other cancers. b cfRNA sequencing preparations were performed with randomized samples in a blinded manner at the time of sample processing. c Patient composition of the CEDAR (discovery) and BCC (validation) cohorts. Figure created using BioRender (https://biorender.com).
Fig. 2
Fig. 2. Identification of intrinsic and extrinsic cfRNA factors using nonnegative matrix factorization.
a Representation of the identification of gene factors and underlying gene count model. A cfRNA dataset of 70 samples from 10 healthy donors was collected, with samples from each donor undergoing seven different handling conditions involving tube type, storage time, and centrifuge setting variations before plasma extraction and sequencing. Nonnegative matrix factorization was performed on the gene count matrix of the dataset to identify the intrinsic and extrinsic factors for each gene. b Expected intrinsic and extrinsic contributions of total gene counts for CEDAR and BCC samples, based on NMF factors. cfRNA normalization balances these contributions across samples (middle panel), while TMM normalization (right panel) adjusts for sample and gene outliers. a created using BioRender (https://biorender.com).
Fig. 3
Fig. 3. Deconvolution of tissue contribution to PDAC cfRNA biomarker levels in plasma.
a Z-score normalized expression for DE genes in top tissues, sorted by total count. Average tissue RNA count values were taken from the Human Protein Atlas version 22.0. DE genes not present in tissue atlas data are omitted (5 total). b Relative comparison of tissue proportions predicted from nu-SVR deconvolution of DE genes in PDAC and all other samples. Tissue proportions from deconvolution are averaged over PDAC and other groups and normalized to sum to 1. Three deconvolutions were performed: using all PDAC samples, PDAC samples without liver metastasis, and stage 1 and 2 PDAC samples. Relative contributions above the 0.50 line indicate elevated tissue proportions in PDAC samples compared to all other diagnoses.
Fig. 4
Fig. 4. Classification model differentiating PDAC from other diagnoses cross-validated in CEDAR cohort.
a PDAC score assigned to each sample in cross-validation, separated by diagnosis group (sample size noted underneath each group). Each row is a different experiment, with the first comparing only PDAC and Benign, PDAC and intermediate pathologies in the second row, and all conditions in the bottom row. Boxplots display the 25th, 50th, and 75th percentiles of groups, with whiskers extending up to 1.5 times beyond inter-quartile range. b, c ROC plots based on PDAC score, and associated AUC values, for each analysis condition. Additional ROC plots are shown for stratification of patients by sex (b) and age (c).
Fig. 5
Fig. 5. Independent validation of the PDAC cfRNA classifier in the separate BCC cohort.
a PDAC score assigned to each sample in the validation set, separated by diagnosis group (sample size noted underneath each group). Each row is a different experiment, with the first comparing only PDAC and Benign, PDAC and intermediate pathologies in the second row, and all conditions in the bottom row. Boxplots display the 25th, 50th, and 75th percentiles of groups, with whiskers extending up to 1.5 times beyond inter-quartile range. b, c ROC plots based on PDAC score, and associated AUC values, for each analysis condition. Additional ROC plots are shown for stratification of patients by sex (b) and age (c).
Fig. 6
Fig. 6. Comparison of cfRNA classifier with CA19-9 measurement.
Measured CA19-9 levels in CEDAR (a) and BCC (b) cohorts. The clinical cutoff value of 37 shown as a dotted line, is used to calculate PPV and NPV for the detection of PDAC. Number of available samples with CA19-9 measurements is shown in parentheses. Boxplots display the 25th, 50th, and 75th percentiles of groups, with whiskers extending up to 1.5 times beyond inter-quartile range. Classifier results using CA19-9, discovered gene set, and discovered gene set plus CA19-9 in CEDAR cross-validation (c) and BCC independent validation (d). *indicates when AUC using DE genes is significantly better than just CA19-9 (P < 0.05, two-sided Delong’s hypothesis test). P values for c (top to bottom) are 0.175, 0.0047, 0.0039. P values for d (top to bottom) are 0.0895, 0.0177, 0.0424.

Similar articles

References

    1. Siegel, R., Miller, K., Fuchs, H. & Jemal, A. Cancer statistics, 2022. CA Cancer J. Clin.72, 7–33 (2022). - PubMed
    1. Bengtsson A., Andersson R. & Ansari D. The actual 5-year survivors of pancreatic ductal adenocarcinoma based on real-world data, Sci. Rep.10, 16425 (2020). - PMC - PubMed
    1. Henrikson, N. et al. Screening for pancreatic cancer: updated evidence report and systematic review for the us preventive services task force. JAMA322, 445–454 (2019). - PubMed
    1. Poruk, K. E. et al. The clinical utility of CA 19-9 in pancreatic adenocarcinoma: diagnostic and prognostic updates. Curr. Mol. Med.13, 340–351 (2013). - PMC - PubMed
    1. Trikudanathan, G., Lou, E., Maitra, A. & Majumder, S. Early detection of pancreatic cancer: current state and future opportunities. Curr. Opin. Gastroenterol.37, 532–538 (2021). - PMC - PubMed

MeSH terms

LinkOut - more resources