. 2025 Aug 10;8(1):1192.
doi: 10.1038/s42003-025-08642-3.

Multi-omics insights of immune cells in the risk and prognosis of idiopathic membranous nephropathy

Affiliations

Multi-omics insights of immune cells in the risk and prognosis of idiopathic membranous nephropathy

Xiaoyi Song et al. Commun Biol. .

Abstract

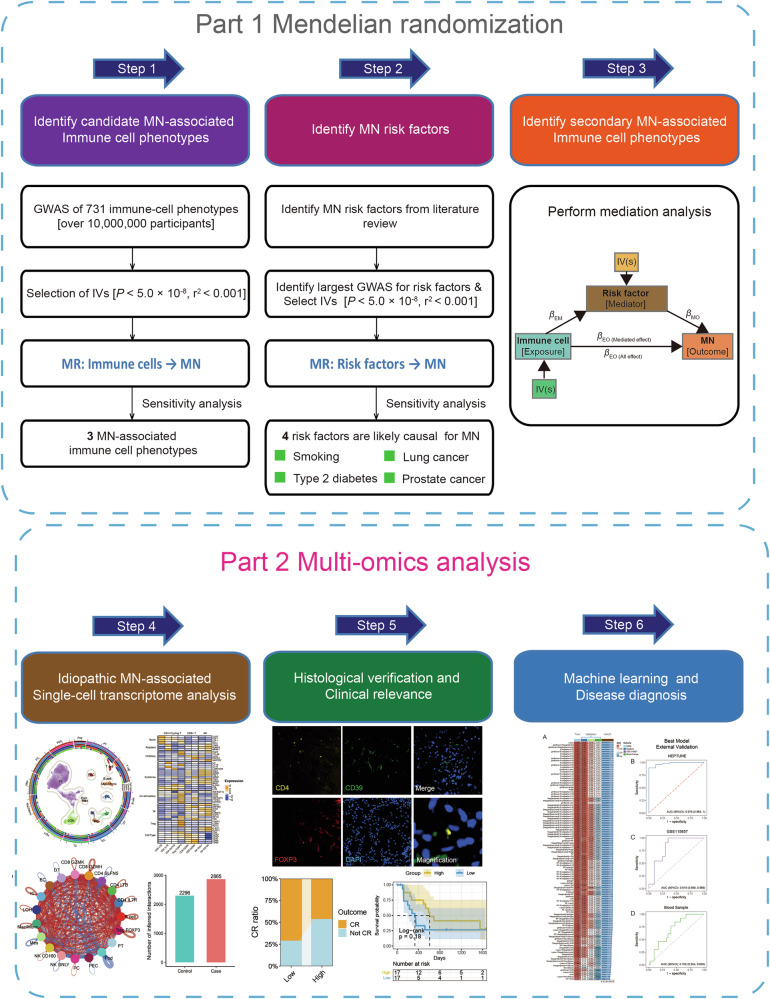
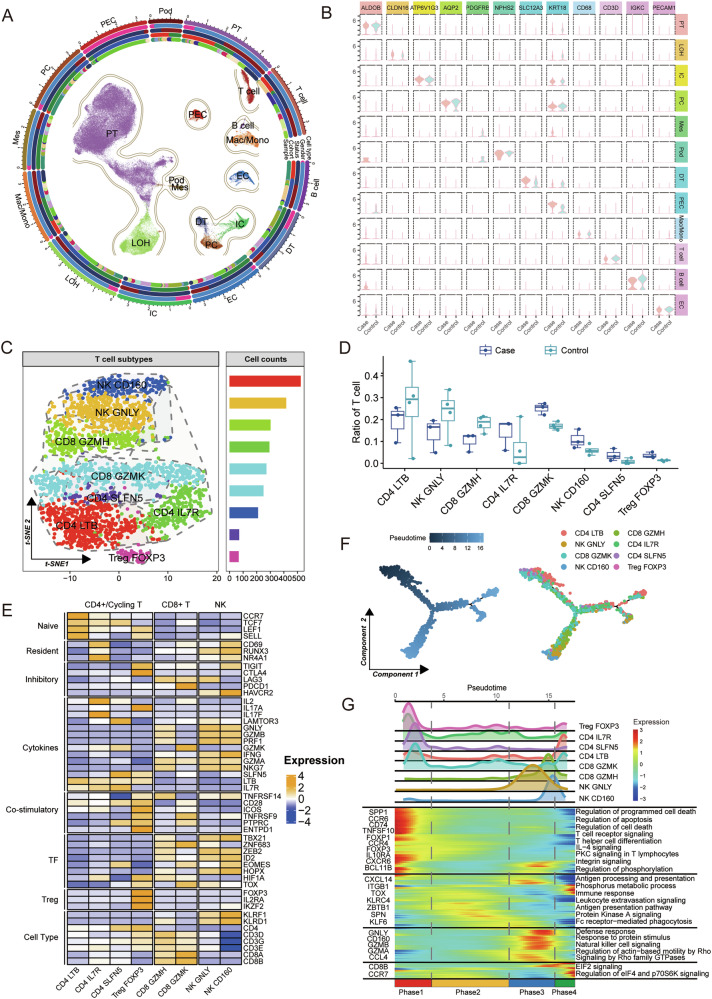
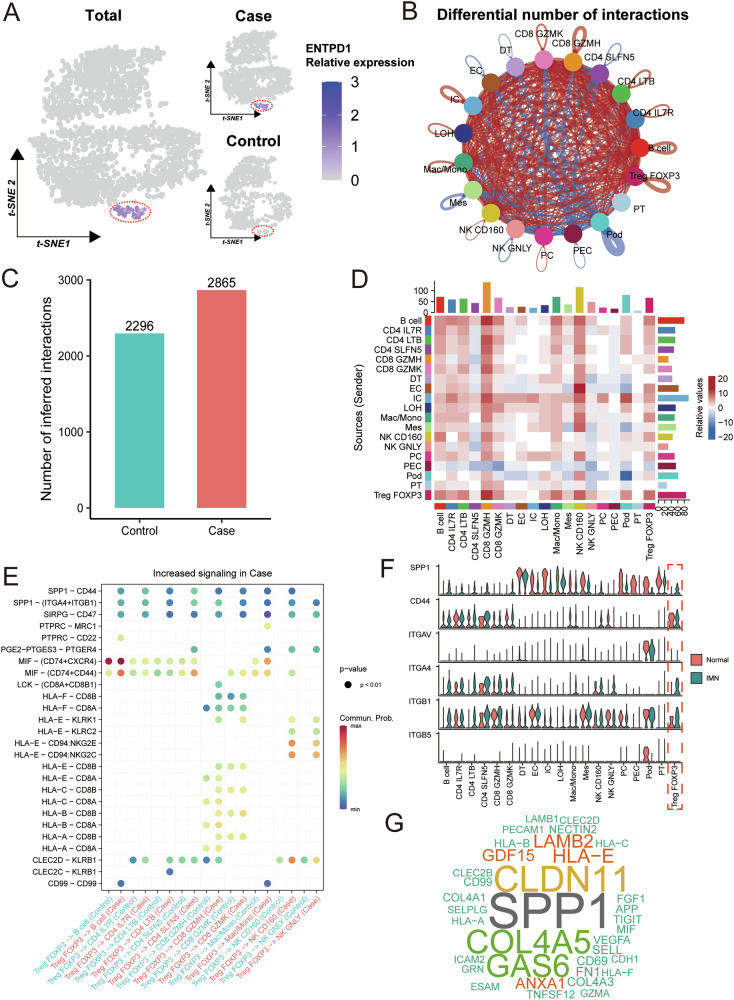
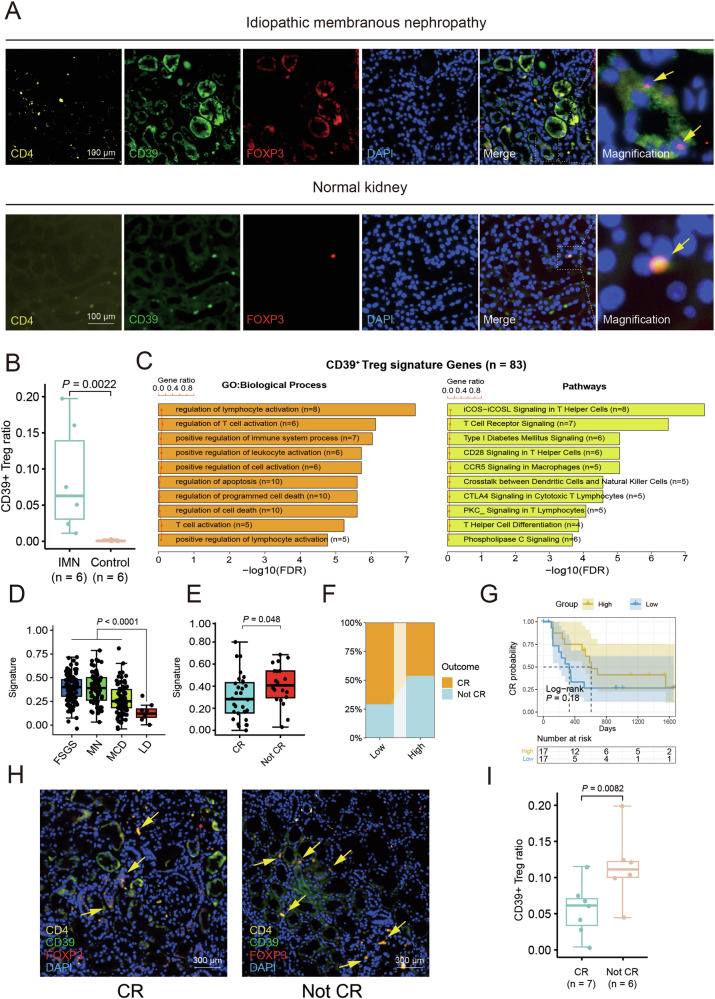
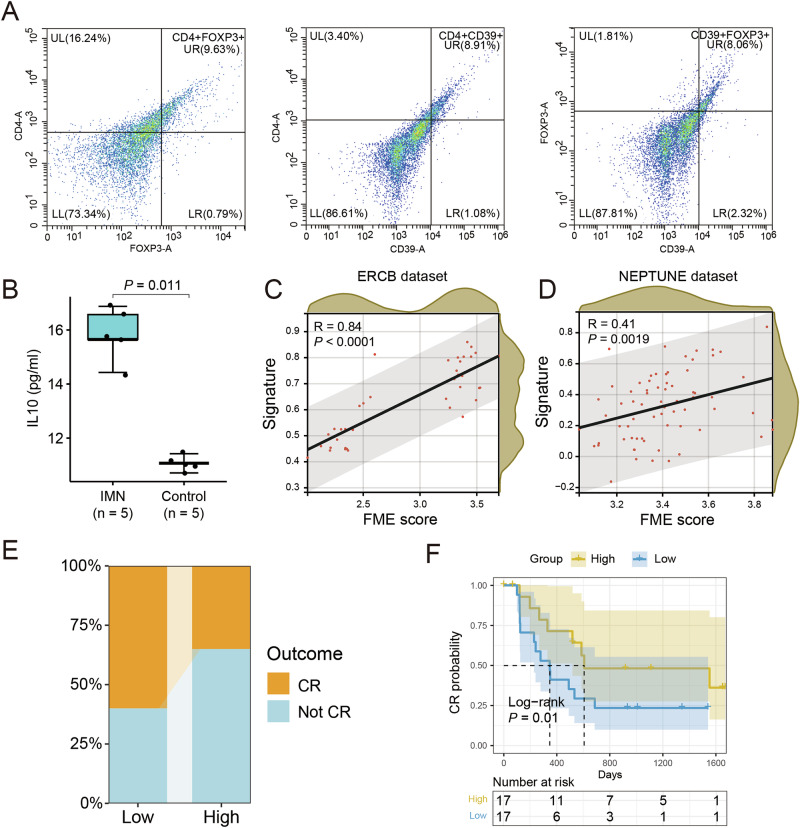
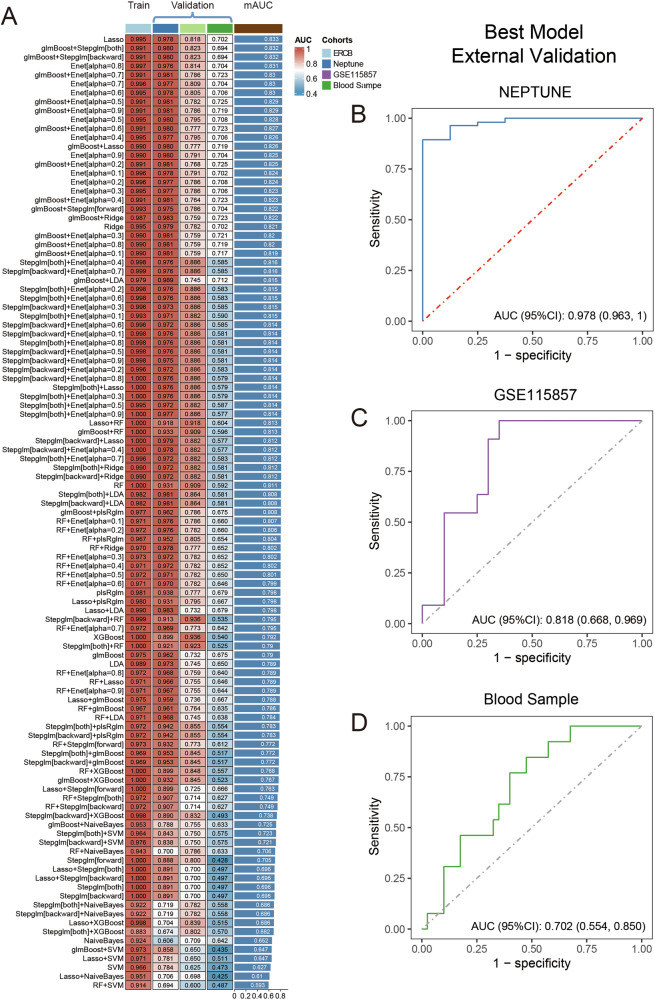
Idiopathic membranous nephropathy (IMN) is the major cause of autoimmune-related nephrotic syndrome. The role immune cells play in the risk and prognosis of IMN remains elusive. We employ multi-omics data and a variety of approaches to evaluate the causal link between 731 immune-cell phenotypes and IMN. In light of the findings emanating from Mendelian randomization analyses, only the regulatory T cell (Treg) subtype (CD39+ Tregs) survived from Bonferroni correction and is causally related to IMN. These cells are significantly enriched in the IMN microenvironment and are negatively correlated with treatment response and prognosis. We validate our findings through multiple immunofluorescence staining and explore the characteristics of CD39+ Tregs using Single-cell transcriptome analysis and flow cytometry. Based on the signature genes of CD39+ Tregs, we construct 107 composited machine-learning models to identify MN. We show the substantial contribution of CD39+ Tregs in both the risk factor determination and prognosis of IMN.


Conflict of interest statement

Competing interests: The authors declare no competing interests.

Figures

Fig. 1
Fig. 1. Study design and workflow of this study.
MN membranous nephropathy, GWAS genome-wide association study, IV instrumental variable, CR complete remission.
Fig. 2
Fig. 2. Mendelian randomization analyses evaluate the causal association between positive immune-cell phenotypes and MN.
A Forest plots to visualize the causal effects of positive immune-cell phenotypes with MN in terms of different MR methods. B Scatter plots to visualize the effect of harmonized SNPs with positive immune-cell phenotypes and MN. C MR leave-one-out sensitivity analyses for positive immune-cell phenotypes on MN. SNP Single-nucleotide polymorphism, OR odds ratio, CI confidence interval, MN membranous nephropathy, MR Mendelian randomization, F F-statistic value.
Fig. 3
Fig. 3. Single-cell transcriptome analysis delineates the landscape of T-cell population in the immune microenvironment of IMN.
A UMAP plot showing the distribution of cell types in the IMN ecosystem from the integrated scRNA-seq datasets included in this study. B Violin plots showing the selected marker genes that were used to identify the cell types in this study. The relative expression level of these genes was compared between IMN samples and healthy kidneys. Case, IMN; Control, healthy kidney. C t-SNE projections of sub-clustered T cells, labeled in different colors. D Boxplots illustrating the fraction of T-cell subtypes in IMN (n = 9) and healthy kidney (n = 6), respectively. The two groups were labeled in different colors. Case, IMN; Control, healthy kidney. The P-value was calculated by the Wilcoxon test. The error bars represent the error margins. E Heatmap indicating the expression of selected gene sets in T-cell subtypes, including naive, resident, inhibitory, cytokines, co-stimulatory, transcriptional factors (TF), and cell types. F Pseudotime-ordered analysis of T-cell subtypes from IMN and healthy samples. T cell subtypes are labeled by colors. G Heatmap showing the dynamic changes in gene expression of T-cell subtypes along the pseudotime (lower panel). The distribution of T-cell subtypes during the transition (divided into 4 phases), along with the pseudo-time. Subtypes are labeled by colors (upper panel). IMN idiopathic membranous nephropathy, PT proximal tubule cells, LOH loop of Henle cells, IC intercalated cells, PC principal cells, Mes mesangial cells, Pod podocytes, DT distal tubule cells, PEC parietal epithelial cells, Mac macrophages, Mono monocytes, EC endothelial cells, Treg regulatory T cell.
Fig. 4
Fig. 4. Differential analysis of cell communication of immune environment between IMN and healthy kidney.
A t-SNE plot showing the relative expression level of ENTPD1 (the coding gene for CD39) in Tregs within the microenvironment of IMN and healthy kidneys. Case, IMN; Control, healthy kidney. B Circle plot showing the differential number of cell-cell interactions among various cell types in the microenvironment between IMN and healthy kidney. The color red indicates the increased interactions, while the color blue represents the decreased interactions. C Barplot compares the total number of inferred cell-cell interactions within the microenvironment of IMN and healthy kidney. Case, IMN; Control, healthy kidney. D Heatmap visualizes the differential number of ligand-receptor interactions among different cell populations between IMN and healthy kidneys. The rows represent the signaling senders’ interactions, and the columns represent the signaling receivers’ interactions. E Bubble plot showing the differential dysfunctional signaling of regulatory T cells with other immune populations in microenvironment of IMN and healthy kidney by comparing the communication probabilities. Case, IMN; Control, healthy kidney. F Violin plots showing the expression level of SPP1-related signaling genes among various cell types in the microenvironment between IMN and healthy kidney. G Wordcloud plot visualizes the differentially enriched signal in IMN compared to the healthy kidney. IMN idiopathic membranous nephropathy, PT proximal tubule cells, LOH loop of Henle cells, IC intercalated cells, PC principal cells, Mes mesangial cells, Pod podocytes, DT distal tubule cells, PEC parietal epithelial cells, Mac macrophages, Mono monocytes, EC endothelial cells, Treg regulatory T cell.
Fig. 5
Fig. 5. Characteristics of CD39+ Treg and the clinical relevance with MN.
A Immunofluorescence images showing the distribution of CD39+ Tregs in IMN and healthy kidney, using antibodies CD4, FOXP3, and CD39. Scale bars, 100 μm. B Boxplots showing the fraction of CD39+ Tregs in IMN (blue) and healthy kidney (red) samples calculated by the regions of interest from immunofluorescence images. The CD39+ Treg ratio was defined as the count of CD39+ Tregs occupies the count of all the cells observed in a slide. The P-value was calculated by the Wilcoxon test. The error bars represent the error margins. C Bar chart showing the enrichment of specific biological processes and signaling pathways of CD39+ Tregs, based on the signature gene set consisting of the marker genes of CD39+ Tregs obtained from the single-cell transcriptome data. The scale bars and line charts were integrated to show the proportion of genes (accounting for the 83 genes) that were enriched in each GO term or pathway. D Boxplots showing the CD39+ Tregs signature scores of different pathological groups of nephrotic syndrome and normal kidney samples in the NEPTUNE dataset. The error bars represent the error margins. E Boxplot showing the CD39+ Tregs signature scores of the complete remission (CR) group and that of the not-CR group. The error bars represent the error margins. F Stacked bar plot showing the CR ratio in high-score and low-score groups (grouped by the median of CD39+ Tregs signature score). G Kaplan-Meier analysis shows the CR rate of patients with the time spent on treatment, characterized by either low (blue) or high (yellow) CD39+ Tregs signature scores. H Immunofluorescence images showing the distribution of CD39+ Tregs in tissue slides of patients who achieved CR or did not after Rituximab treatment, using antibodies CD4, FOXP3, and CD39. Scale bars, 300 μm. I Boxplots showing the fraction of CD39+ Tregs in CR (blue) and Not-CR (red) IMN samples calculated by the regions of interest from immunofluorescence images. The CD39+ Treg ratio was defined as the count of CD39+ Tregs occupies the count of all the cells observed in a slide. The P-value was calculated by the Wilcoxon test. The error bars represent the error margins. The median CR time, the number of patients, and the risk classification are indicated in the figure. Significance was calculated using the log-rank test. MN membranous nephropathy, IMN idiopathic membranous nephropathy, FSGS focal segmental glomerular sclerosis, MCD minimal change disease, LD live donor, CR complete remission.
Fig. 6
Fig. 6. CD39+ Tregs have a stronger immunosuppressive function in IMN patients and is associated with the fibrosis process.
A Flow cytometry sorting of CD39+ Treg cells. B Boxplots showing the IL-10 secretion concentration (pg/ml) of CD39+ Tregs in IMN (blue) patients and healthy donors (red). The error bars represent the error margins. C Scatter plot showing the Spearman correlation between the CD39+ Tregs signature score and the FME score in patients with MN of ERCB dataset. D Scatter plot showing the Spearman correlation between the CD39+ Tregs signature score and the FME score in patients with IMN of NEPTUNE dataset. E Stacked bar plot showing the CR ratio in high-score and low-score groups (grouped by the median of FME score). F Kaplan–Meier analysis shows the CR rate of patients with the time spent on treatment, characterized by either low (blue) or high (yellow) FME scores. FME fibrotic microenvironment, MN membranous nephropathy, CR complete remission.
Fig. 7
Fig. 7. Construction and validation of the MN diagnostic model based on CD39+ Tregs signature genes.
A The area under ROC curve (AUC) values of 107 machine-learning algorithm combinations in the development cohort and three external validation cohorts. B The ROC curve of the best model in the NEPTUNE dataset. C The ROC curve of the best model in the GSE115857 dataset. D The ROC curve of the best model in the Blood Sample dataset was generated in this study. The AUC value and the corresponding 95% confidence interval are labeled.

Similar articles

References

    1. Ronco, P. et al. Membranous nephropathy. Nat. Rev. Dis. Prim.7, 69 (2021). - PubMed
    1. Couser, W. G. Primary membranous nephropathy. Clin. J. Am. Soc. Nephrol.12, 983–997 (2017). - PMC - PubMed
    1. Mcgrogan, A., Franssen, C. F. & De Vries, C. S. The incidence of primary glomerulonephritis worldwide: a systematic review of the literature. Nephrol. Dial. Transpl.26, 414–430 (2011). - PubMed
    1. Cattran, D. C. & Brenchley, P. E. Membranous nephropathy: integrating basic science into improved clinical management. Kidney Int91, 566–574 (2017). - PubMed
    1. Ronco, P. & Debiec, H. Pathophysiological advances in membranous nephropathy: time for a shift in patient’s care. Lancet385, 1983–1992 (2015). - PubMed

LinkOut - more resources