. 2025 Aug 9;16(1):1515.
doi: 10.1007/s12672-025-03195-7.

SPINT1-AS1 promotes oxidative damage and apoptosis of gastric cancer cells via the miR-656-3p/PLCXD3 axis

Affiliations

SPINT1-AS1 promotes oxidative damage and apoptosis of gastric cancer cells via the miR-656-3p/PLCXD3 axis

Duo Xu et al. Discov Oncol. .

Abstract

Background and objectives: In the study of gastric cancer (GC), long non-coding RNAs (lncRNAs) have been identified and their functions have been partly characterized; however, the specific function of SPINT1 antisense RNA 1 (SPINT1-AS1) in GC remains unclear. This study aimed to investigate the role of SPINT1-AS1 in GC cells and elucidate its downstream molecular mechanisms.

Methods: SPINT1-AS1, microRNA-656-3p (miR-656-3p), and phospholipase C, X domain containing 3 (PLCXD3) levels were modulated in GC cells through transfection experiments. Quantitative reverse transcription polymerase chain reaction and Western blot analyses were performed to assess SPINT1-AS1, miR-656-3p, and PLCXD3 levels. The proliferative capacity, apoptosis, invasion, migration, and oxidative stress levels of GC cells were evaluated using 5-ethynyl-2'-deoxyuridine assay, colony formation assay, flow cytometry, Transwell assays, and commercial kits, respectively. Dual-luciferase reporter assay and RNA immunoprecipitation assay were conducted to assess the targeting relationships among SPINT1-AS1, miR-656-3p, and PLCXD3. The impact of SPINT1-AS1 on GC tumor growth was examined in xenograft tumor models.

Results: SPINT1-AS1 and PLCXD3 were found to be downregulated in GC, whereas miR-656-3p was upregulated. SPINT1-AS1 elevation inhibited GC cell proliferation, invasion, migration, and oxidative stress, and promoted apoptosis. SPINT1-AS1 knockdown had opposite effects. The pro-tumor effects induced by SPINT1-AS1 knockdown were reversed by concomitant knockdown of miR-656-3p. Similarly, the inhibitory effects of SPINT1-AS1 elevation on GC malignancy were abrogated by PLCXD3 knockdown. SPINT1-AS1 knockdown suppressed GC tumor growth in mice. SPINT1-AS1 competitively bound to miR-656-3p to mediate PLCXD3 expression.

Conclusions: SPINT1-AS1 suppresses GC malignancy through the regulation of the miR-656-3p/PLCXD3 axis. These findings provide robust data supporting the biological functions of lncRNAs in GC and offer potential targets for therapeutic intervention.

Keywords: Gastric cancer; Oxidative damage; PLCXD3; SPINT1-AS1; miR-656-3p.


Conflict of interest statement

Declarations. Ethical approval and consent to participate: All animal experiments were complied with the ARRIVE guidelines and performed in accordance with the National Institutes of Health Guide for the Care and Use of Laboratory Animals. The experiments were approved by the Institutional Animal Care and Use Committee of Shaanxi Provincial Cancer Hospital (No. 2020-XA024). Competing interests: The authors declare no competing interests.

Figures
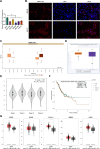
Fig. 1
Fig. 1
Abnormally low expression of SPINT1-AS1 in GC. A RT-qPCR measured SPINT1-AS1 in 5 GC cell lines and normal gastric mucosa cell line. B FISH assay analyzed the subcellular localization of SPINT1-AS1. C The website (http://lncatlas.crg.eu/) queried the subcellular location of SPINT1-AS1. D Analysis of differential expression of SPINT1-AS1 in GC tissue samples (375 cases) and normal tissue samples (32 cases) based on TCGA database. E Correlation between SPINT1-AS1 and TNM stage of GC patients based on TCGA database; F TCGA database analyzed the relationship between SPINT1-AS1 and survival rate of GC patients. G Expression patterns of five potential RBPs interacting with SPINT1-AS1 in GC analyzed by TCGA database. Data were expressed as mean ± SD (n = 3). *P < 0.05
Fig. 2
Fig. 2
SPINT1-AS1 inhibits GC proliferation, invasion and migration, and oxidative stress and promotes apoptosis. MKN-28 and HGC-27 cells were transfected with pcDNA 3.1 overexpression vector targeting SPINT1-AS1. A RT-qPCR measured SPINT1-AS1. B, C EdU assay and colony formation assay analyzed cell proliferation. D Flow cytometry evaluated cell apoptosis rate. E Transwell detected cell invasion and migration. F DCFH-DA combined with flow cytometry assessed ROS levels in cells. G Commercial kits or ELISA measured MDA, SOD, CAT and GSH-Px. Data were expressed as mean ± SD (n = 3). *P < 0.05
Fig. 3
Fig. 3
Competitive adsorption of miR-656-3p by SPINT1-AS1. A RT-qPCR measured five potential miRNAs with binding sites to SPINT1-AS1 in MKN-28 and HGC-27 cells. B RIP test examined the binding between SPINT1-AS1 and potential miRNAs. C starbase predicted the binding sites of SPINT1-AS1 and miR-656-3p. D Dual luciferase reporting assay verified the targeting relationship between SPINT1-AS1 and miR-656-3p. E RT-qPCR measured miR-656-3p in 5 GC cell lines and normal gastric mucosa cell line. F RT-qPCR studied the effect of SPINT1-AS1 overexpression on miR-656-3p expression. Data were expressed as mean ± SD (n = 3). *P < 0.05
Fig. 4
Fig. 4
MiR-656-3p participates in the SPINT1-AS1-regulated GC progression. si-SPINT1-AS1 and miR-656-3p-inhibitor were co-transfected into MKN-28 and HGC-27 cells. A RT-qPCR measured miR-656-3p. B, C EdU assay and colony formation assay analyzed cell proliferation. D Flow cytometry evaluated cell apoptosis rate. E Transwell detected cell invasion and migration. F DCFH-DA combined with flow cytometry assessed ROS levels in cells. G Commercial kits or ELISA measured MDA, SOD, CAT and GSH-Px. Data were expressed as mean ± SD (n = 3). *P < 0.05
Fig. 5
Fig. 5
PLCXD3 is regulated by miR-656-3p. A RT-qPCR measured expression levels of five potential mRNAs with miR-656-3p binding sites in MKN-28 and HGC-27 cells. B TCGA database analyzed PLCXD3 in gastric adenocarcinoma. C RIP test checked the binding relationship between miR-656-3p and PLCXD3. D starbase predicted the binding sites of miR-656-3p to PLCXD3. E Dual luciferase reporting assay verified the targeting relationship between miR-656-3p and PLCXD3. F Western blot detected PLCXD3 in 5 GC cell lines and normal gastric mucosa cell line. G Analysis of PLCXD3 expression in GC tissue samples (375 cases) and normal tissue samples (32 cases) based on the TCGA database. H Correlation between PLCXD3 and TNM staging in GC patients. I GEPIA database analyzed the relationship between PLCXD3 and survival rate of patients with gastric adenocarcinoma. J Western blot detected the effect of overexpression or knockdown of miR-656-3p on PLCXD3. Data were expressed as mean ± SD (n = 3). *P < 0.05
Fig. 6
Fig. 6
SPINT1-AS1 regulates GC malignant behaviors by regulating the miR-656-3p/PLCXD3 axis. pcDNA 3.1-SPINT1-AS1 and si-PLCXD3 were co-transfected into MKN-28 and HGC-27 cells. A RT-qPCR measured SPINT1-AS1 and miR-656-3p. B Western blot detected PLCXD3. C, D EdU assay and colony formation assay analyzed cell proliferation. E Flow cytometry evaluated cell apoptosis rate. F Transwell detected cell invasion and migration. G DCFH-DA combined with flow cytometry assessed ROS levels in cells. H Commercial kits or ELISA measured MDA, SOD, CAT and GSH-Px. Data were expressed as mean ± SD. *P < 0.05
Fig. 7
Fig. 7
SPINT1-AS inhibits Wnt/β-catenin pathway activation in GC by regulating miR-656-3p/PLCXD3 axis. A, B Western blot for protein expression of active-β-catenin, p-GSK-3β and GSK-3β in MKN-28 cells. C, D Western blot for protein expression of Nrf2 and HO-1 in MKN-28 cells. Data were expressed as mean ± SD. *P < 0.05
Fig. 8
Fig. 8
PLCXD3 inhibits Wnt/β-catenin pathway activation by promoting MALAT1 degradation. A starbase website analyzed the potential binding sites of PLCXD3 and MALAT1. B RT-qPCR detected the expression pattern of MALAT1 in normal cell lines and five GC cell lines. C TCGA and GTEx data analyzed the expression pattern of MALAT1 in GC tissues and normal tissues. D RNase assay detected the effect of overexpression of PLCXD3 on MALAT1 RNA stability. E RIP assay detected the binding relationship between PLCXD3 and MALAT1. F RT-qPCR detected the effect of knockdown or overexpression of PLCXD3 on MALAT1 RNA expression. G Western blot detected the effect of overexpression of PLCXD3 while overexpression of MALAT1 on the expression of active-β-catenin, p-GSK-3β and GSK-3β protein expression. Data were expressed as mean ± SD (n = 3). *P < 0.05
Fig. 9
Fig. 9
SPINT1-AS1 inhibits GC tumor growth. A Representative pictures of tumors. B Tumor volume. C Tumor weight. D IHC staining analyzed Ki-67 and PLCXD3 in tumor tissues. The experiment was repeated three times independently. Data were expressed as mean ± SD (5 mice/group). *P < 0.05

Similar articles

References

    1. Smyth EC, Nilsson M, Grabsch HI, van Grieken NC, Lordick F. Gastric cancer. Lancet. 2020;396(10251):635–48. - PubMed
    1. Karimi P, Islami F, Anandasabapathy S, Freedman ND, Kamangar F. Gastric cancer: descriptive epidemiology, risk factors, screening, and prevention. Cancer Epidemiol Biomark Prev. 2014;23(5):700–13. - PMC - PubMed
    1. Hall CE, Maegawa F, Patel AD, Lin E. Management of gastric cancer. Am Surg. 2023;31348221148359.
    1. Lu C, Zhou D, Wang Q, Liu W, Yu F, Wu F, et al. Crosstalk of MicroRNAs and oxidative stress in the pathogenesis of cancer. Oxid Med Cell Longev. 2020;2020:2415324. - PMC - PubMed
    1. Gill JG, Piskounova E, Morrison SJ, Cancer. Oxidative stress, and metastasis. Cold Spring Harb Symp Quant Biol. 2016;81:163–75. - PubMed

LinkOut - more resources