

Global burden of chronic kidney disease due to hypertension (1990-2021): a systematic analysis of epidemiological trends, risk factors, and projections to 2036 from the GBD 2021 study
- PMID: 40783694
- PMCID: PMC12335775
- DOI: 10.1186/s12882-025-04386-8
Global burden of chronic kidney disease due to hypertension (1990-2021): a systematic analysis of epidemiological trends, risk factors, and projections to 2036 from the GBD 2021 study
Abstract
Background: Hypertension is a major risk factor for chronic kidney disease (CKD), and the global burden of CKD due to hypertension is rising with population aging. Previous GBD-related studies on CKD have limitations, and the updated global burden of disease (GBD) 2021 database can provide a more comprehensive understanding.
Objective: This study aims to analyze the global, regional, and national burden of CKD due to hypertension from 1990 to 2021, identify risk factors, and project trends until 2036.
Method: Data from the GBD 2021 study for 204 countries and territories were used. Prevalence, incidence, deaths, and disability-adjusted life years (DALYs) of CKD due to hypertension were analyzed. Decomposition analysis, frontier analysis, and predictive analysis were performed. The impact of level 3 risk factors was also assessed.
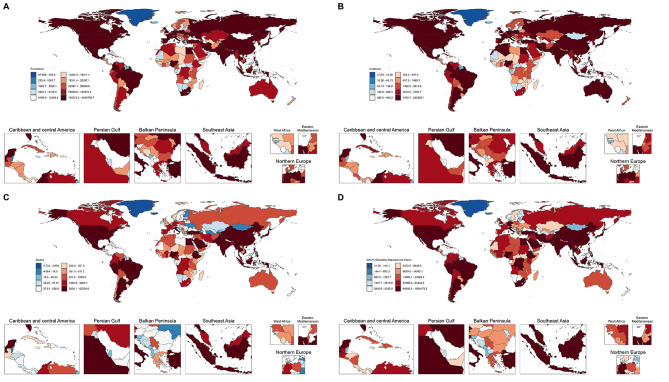
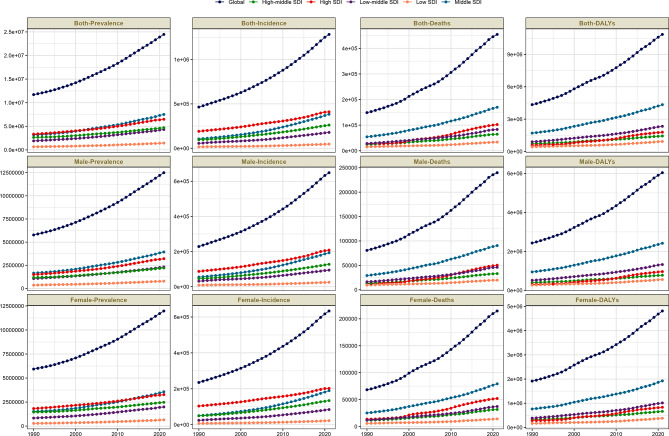
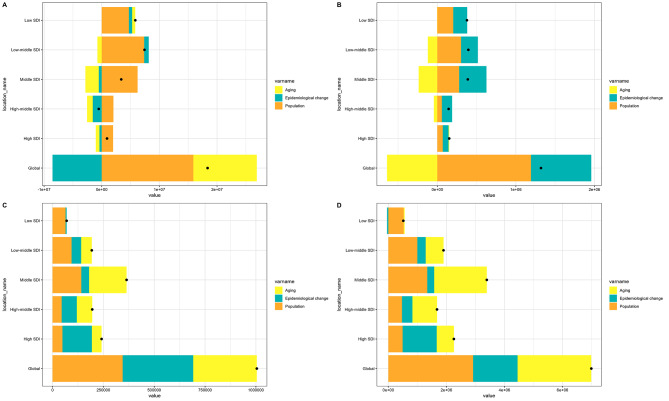
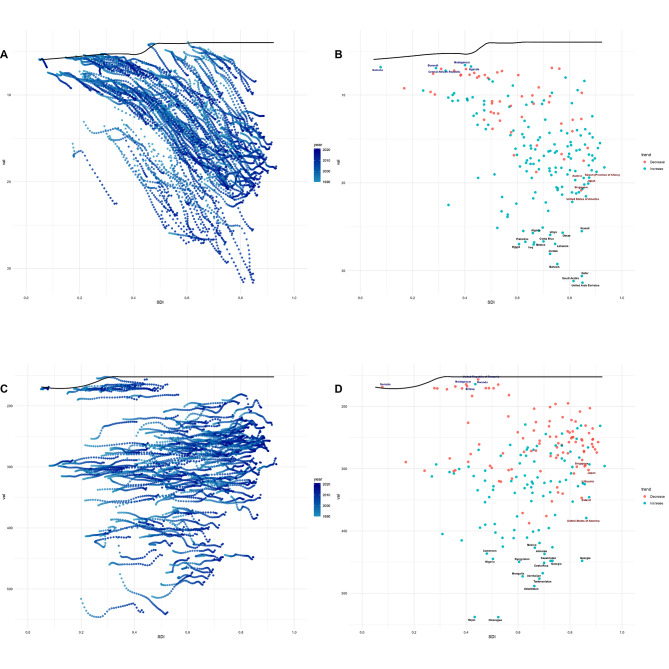
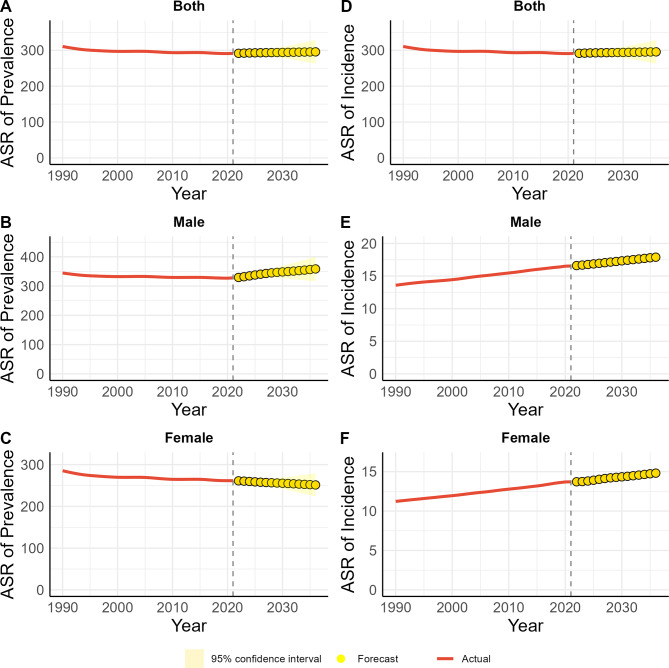
Results: In 2021, the global prevalence of CKD attributed to hypertension exceeded 24 million cases, with an age-standardized prevalence rate of 291.19 per 100,000. The incidence of such CKD cases surpassed 1.28 million, corresponding to an age-standardized incidence rate of 14.97 per 100,000. Mortality from CKD due to hypertension claimed over 454,000 lives, translating to an age-standardized mortality rate of 5.54 per 100,000. Additionally, the disease inflicted more than 10.85 million DALYs, which equates to an age-standardized DALYs rate of approximately 128.41 per 100,000. There were gender and age differences in the disease burden. Decomposition analysis indicated that population growth aggravated the disease burden in different aspects, and epidemiological changes and aging had varying effects. Frontier analysis revealed disparities among regions with different socio-demographic index (SDI) levels. Predictive analysis showed that from 2021 to 2036, the overall prevalence and incidence would remain stable with gender differences, and the age-standardized rates of mortality and DALYs would continue to rise. Dietary risk factors, especially low fruit intake, were the main contributors, along with low-temperature and lead exposure.
Conclusions: Despite a decline in age-standardized prevalence in some aspects, the overall disease burden of CKD due to hypertension has increased. Targeted strategies such as gender-and age-specific prevention, dietary improvements, environmental protection, and optimized medical resource allocation are essential to address this public-health challenge.
Keywords: CKD due to hypertension; Epidemiology and public health; Frontier analysis; Global burden of disease; Predictive analysis; Risk factors.
© 2025. The Author(s).
Conflict of interest statement
Declarations. Ethics approval and consent to participate: Not applicable. Patient and public involvement: Not applicable. Consent to participate: Not applicable. Competing interests: The authors declare no competing interests.
Figures
Similar articles
-
Global trends of chronic kidney disease from 1990 to 2021: a systematic analysis for the global burden of disease study 2021.BMC Nephrol. 2025 Jul 14;26(1):385. doi: 10.1186/s12882-025-04309-7. BMC Nephrol. 2025. PMID: 40660180 Free PMC article.
-
Burden of knee osteoarthritis in China and globally: 1990-2045.BMC Musculoskelet Disord. 2025 Jul 1;26(1):582. doi: 10.1186/s12891-025-08858-8. BMC Musculoskelet Disord. 2025. PMID: 40598022 Free PMC article.
-
Global pattern, trend and cross-country inequalities of inguinal, femoral, and abdominal hernia among individuals aged 60 and above from 1990 to 2021 and projections until 2040: a population-based study.Surg Endosc. 2025 Jul;39(7):4335-4344. doi: 10.1007/s00464-025-11810-5. Epub 2025 May 28. Surg Endosc. 2025. PMID: 40437076
-
Burden of inflammatory bowel disease among elderly, 1990-2019: A systematic analysis based on the global burden of disease study 2019.Autoimmun Rev. 2025 Jan 31;24(2):103708. doi: 10.1016/j.autrev.2024.103708. Epub 2024 Nov 23. Autoimmun Rev. 2025. PMID: 39586389
-
Nephron number variability in Japanese subjects: an autopsy-based study and its implications for chronic kidney disease: clinical scientist award address 2024.Clin Exp Nephrol. 2025 Aug;29(8):1005-1011. doi: 10.1007/s10157-025-02662-3. Epub 2025 Apr 19. Clin Exp Nephrol. 2025. PMID: 40252154 Free PMC article. Review.
References
-
- Xie Y, Bowe B, Mokdad AH, Xian H, Yan Y, Li T, Maddukuri G, Tsai C-Y, Floyd T, Al-Aly Z. Analysis of the global burden of disease study highlights the global, regional, and National trends of chronic kidney disease epidemiology from 1990 to 2016. Kidney Int. 2018;94:567–81. 10.1016/j.kint.2018.04.011. - PubMed
-
- Liu KS, Wang B, Mak IL, Choi EP, Lam CL, Wan EY. Early onset of hypertension and increased relative risks of chronic kidney disease and mortality: two population-based cohort studies in united Kingdom and Hong Kong. Hypertens Res. 2025. 10.1038/s41440-025-02188-x. - PubMed
MeSH terms
Grants and funding
- B2024153/General Project of Scientific Research Program of Hunan Provincial Administration of Traditional Chinese Medicine: Evaluation of Clinical Efficacy and Research on Related Mechanisms of Xie's Qizhen Acupuncture Therapy in Treating Diabetic Peripheral Neuropathy
- Tai Wei Fa [2020] 52/The third round of Taizhou Traditional Chinese Medicine (Integrated Traditional Chinese and Western Medicine) key (supported) disciplines
LinkOut - more resources
Full Text Sources
Medical
