

Comprehensive study on softness mechanisms and the metabolic pattern of key cell wall components in tobacco leaves during the curing stage
- PMID: 40783695
- PMCID: PMC12335083
- DOI: 10.1186/s12870-025-07111-7
Comprehensive study on softness mechanisms and the metabolic pattern of key cell wall components in tobacco leaves during the curing stage
Abstract
Background: Curing is an essential process for transforming tobacco leaves into an economic product. Optimizing curing parameters to regulate the orderly senescence and apoptosis of tobacco cells serves as a direct approach to enhancing the softness of leaves and a critical guarantee of quality. Therefore, understanding the intrinsic mechanisms underlying leaf softening during curing is vital for curing conditions and improving tobacco usability.
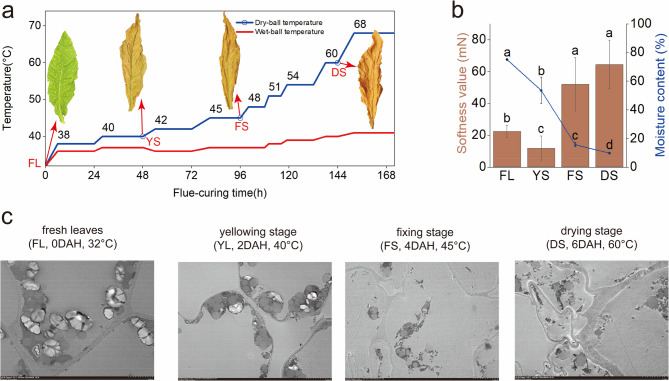
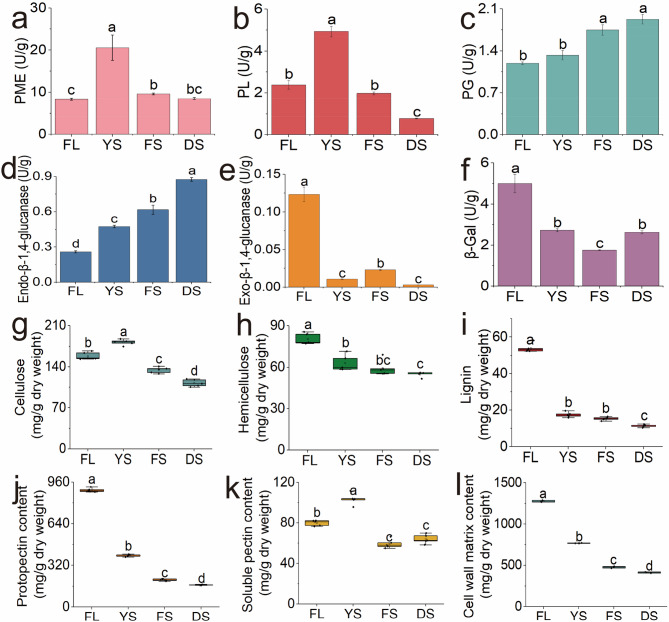
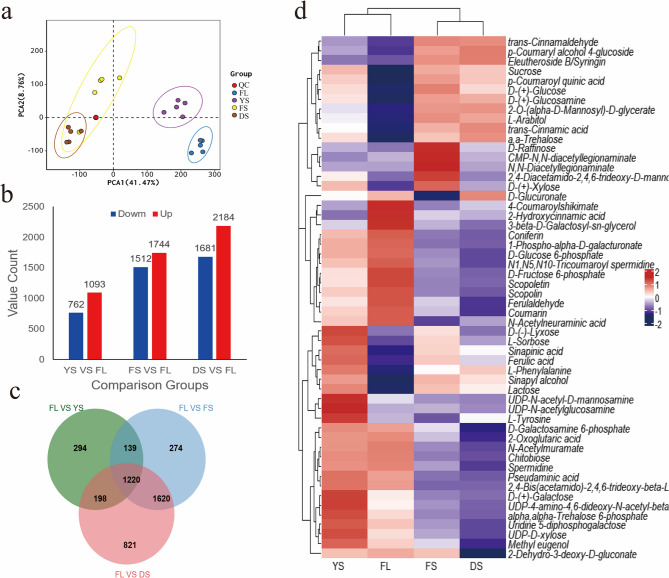
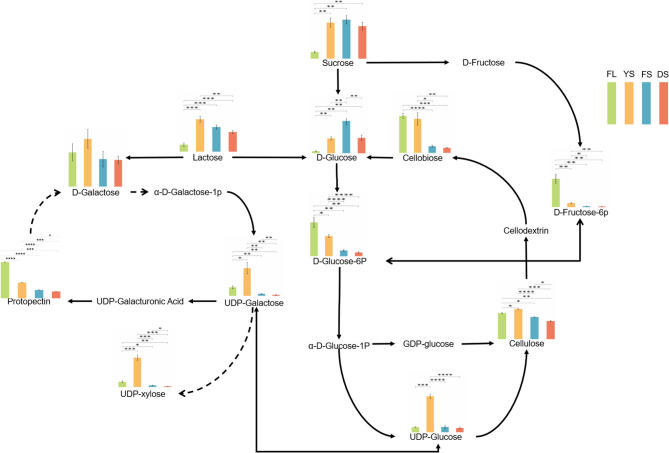
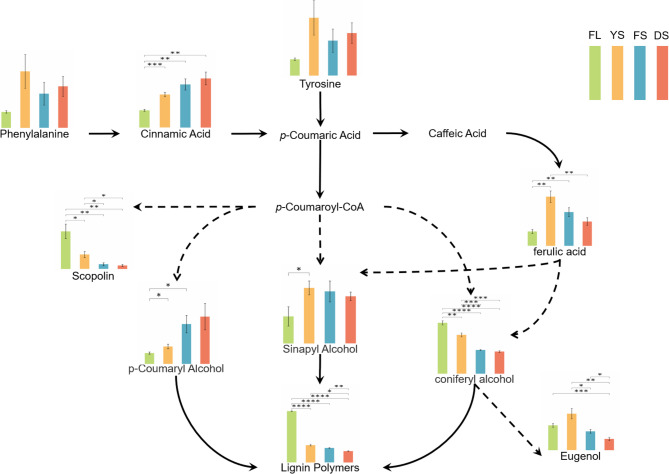
Results: To elucidate the degradation patterns of key cell wall components and dynamic changes in related enzyme activities during the softening of tobacco leaves during curing stage, we systematically analyzed the softening progression, cell wall structure, and dynamic transformation of key metabolites in the flue-cured variety Yunyan 87. The results demonstrated that leaf softness peaked during the yellowing stage (minimal softness value: 11.83mN). The cell wall structure progressively disintegrated throughout curing. Pectin methylesterase (PME), polygalacturonase (PG), and pectin lyase (PL) exhibited higher activities in fresh leaves and the yellowing stage, with corresponding values of 8.33 and 20.56 U/g for PME, 1.20 and 1.33 U/g for PG, and 2.39 and 4.93 U/g for PL. The cell wall matrix content decreased significantly during curing, reaching 412.84 mg/g in the drying stage.LC-MS/MS analysis identified 1,220 metabolites with significant alterations during curing, 54 of which were closely associated with cell wall metabolism. We further delineated metabolic pathways for cellulose, pectin, and lignin.
Conclusions: This study comprehensively investigated the metabolic basis of tobacco leaf softening during curing, identifying the fresh leaves and yellowing stage as critical regulatory nodes. These findings provide valuable references for optimizing tobacco curing parameters.
Keywords: Cell wall components; Curing stage; Flue-cured tobacco; Metabolic pattern; Softness mechanisms.
© 2025. The Author(s).
Conflict of interest statement
Declarations. Ethics approval and consent to participate: Not applicable. Consent for publication: Not applicable. Competing interests: The authors declare no competing interests.
Figures
Similar articles
-
A pectin methylesterase inhibitor NtPMEI21 negatively regulates resistance to brown spot disease in Nicotiana tabacum L.Plant Sci. 2025 Oct;359:112635. doi: 10.1016/j.plantsci.2025.112635. Epub 2025 Jun 27. Plant Sci. 2025. PMID: 40582646
-
Fungal Composition and Diversity of the Tobacco Leaf Phyllosphere During Curing of Leaves.Front Microbiol. 2020 Sep 4;11:554051. doi: 10.3389/fmicb.2020.554051. eCollection 2020. Front Microbiol. 2020. PMID: 33013785 Free PMC article.
-
Transcriptomic analysis of Camellia japonica to scale insects infestation and functional characterization of pectin methylesterase gene CjPME28 and polygalacturonase gene CjPG1.Plant Cell Rep. 2025 Jul 31;44(8):186. doi: 10.1007/s00299-025-03580-0. Plant Cell Rep. 2025. PMID: 40745418
-
Interventions to increase adherence to medications for tobacco dependence.Cochrane Database Syst Rev. 2015 Feb 23;(2):CD009164. doi: 10.1002/14651858.CD009164.pub2. Cochrane Database Syst Rev. 2015. Update in: Cochrane Database Syst Rev. 2019 Aug 16;8:CD009164. doi: 10.1002/14651858.CD009164.pub3. PMID: 25914910 Updated.
-
Incentives for preventing smoking in children and adolescents.Cochrane Database Syst Rev. 2017 Jun 6;6(6):CD008645. doi: 10.1002/14651858.CD008645.pub3. Cochrane Database Syst Rev. 2017. PMID: 28585288 Free PMC article.
References
-
- Zhang BC, Gao Y, Zhang LJ, Zhou YH. The plant cell wall: biosynthesis, construction, and functions. J Integr Plant Biol. 2021;63:251–72. 10.1111/jipb.13055. - PubMed
-
- Somerville C, Bauer S, Brininstool G, Facette M, Hamann T, Milne J, Osborne E, Paredez A, Persson S, Raab T, Vorwerk S, Youngs H. Toward a systems approach to understanding plant cell walls. Science. 2004;306:2206–11. 10.1126/science.1102765. - PubMed
-
- Mercado JA, Pliego-Alfaro F, Quesada MA. Fruit shelf life and potential for its genetic improvement. Breed Fruit Qual. 2011;81–104. 10.1002/9780470959350.ch4.
-
- Yang L, Cong P, He J, Bu H, Qin S, Lyu D. Differential pulp cell wall structures lead to diverse fruit textures in Apple (Malus domestica). Protoplasma. 2022;259:905–21. 10.1007/s00709-021-01727-w. - PubMed
MeSH terms
Substances
Grants and funding
LinkOut - more resources
Full Text Sources
Research Materials
