. 2025 Aug 9;32(1):73.
doi: 10.1186/s12929-025-01165-3.

CD24a knockout results in an enhanced macrophage- and CD8⁺ T cell-mediated anti-tumor immune responses in tumor microenvironment in a murine triple-negative breast cancer model

Affiliations

CD24a knockout results in an enhanced macrophage- and CD8⁺ T cell-mediated anti-tumor immune responses in tumor microenvironment in a murine triple-negative breast cancer model

Shih-Hsuan Chan et al. J Biomed Sci. .

Abstract

Background: CD24 plays a crucial role not only in promoting tumor progression and metastasis but also in modulating macrophage-mediated anti-tumor immunity. However, its impact on the immune landscape of the tumor microenvironment (TME) remains unexplored. Here, we investigated the role of CD24a, the murine CD24 gene, in tumor progression and TME immune dynamics in a murine triple-negative breast cancer (TNBC) model.

Methods: Clustered Regularly Interspaced Short Palindromic Repeat (CRISPR)/Cas9 knockout technology was employed to generate CD24a knockout in the murine TNBC cell line 4T1. Flow cytometry was utilized to analyze the immune cell populations, including myeloid-derived suppressor cells (MDSCs), natural killer cells, T cells, and macrophages, within tumors, spleens, and bone marrow in the orthotopic mouse 4T1 breast cancer model. Immunofluorescence (IF) staining was used to detect the immune cells in tumor sections. High-speed confocal was used to perform three-dimensional (3D) mapping of immune cells in the 4T1 orthotopic tumors.

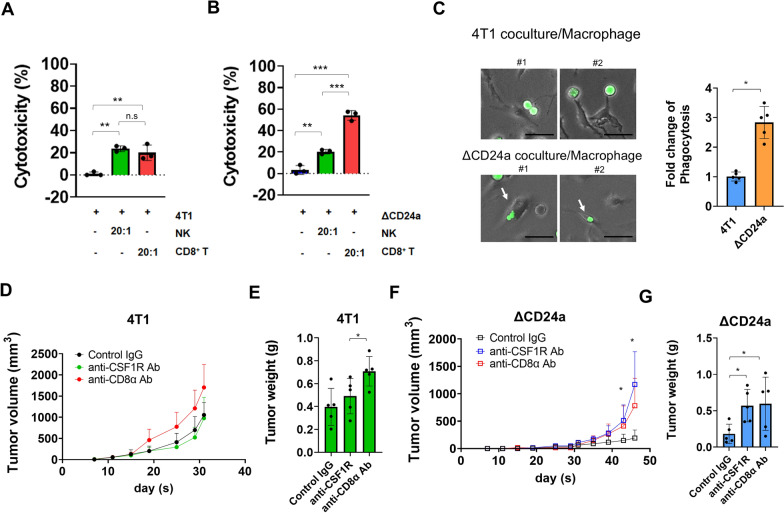
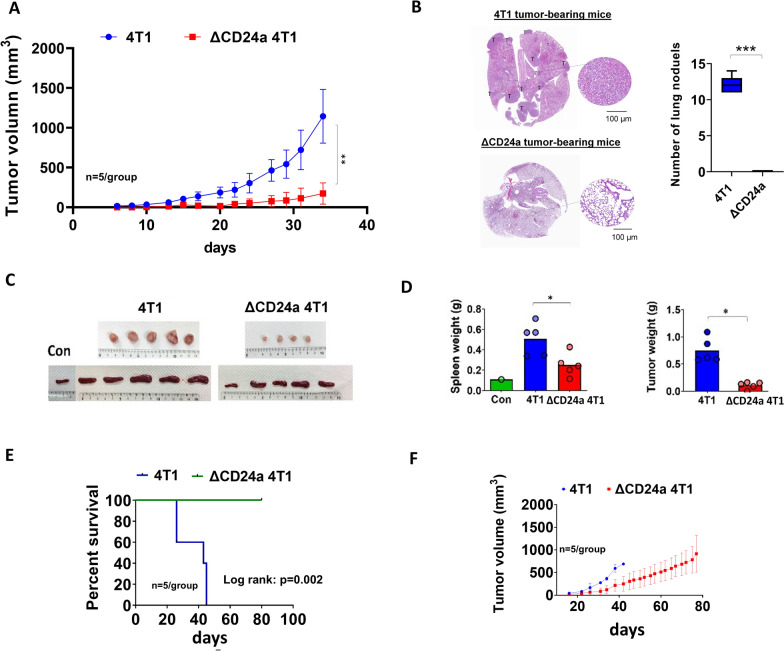
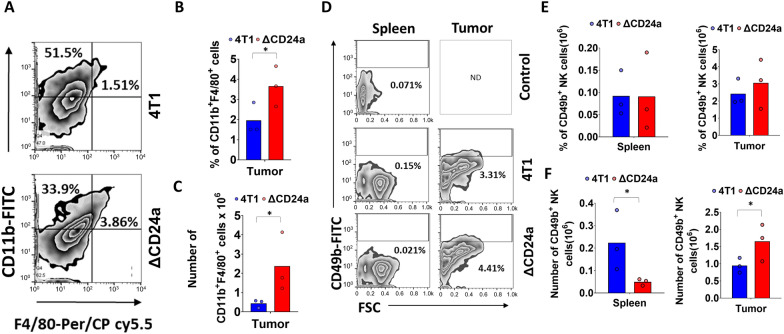
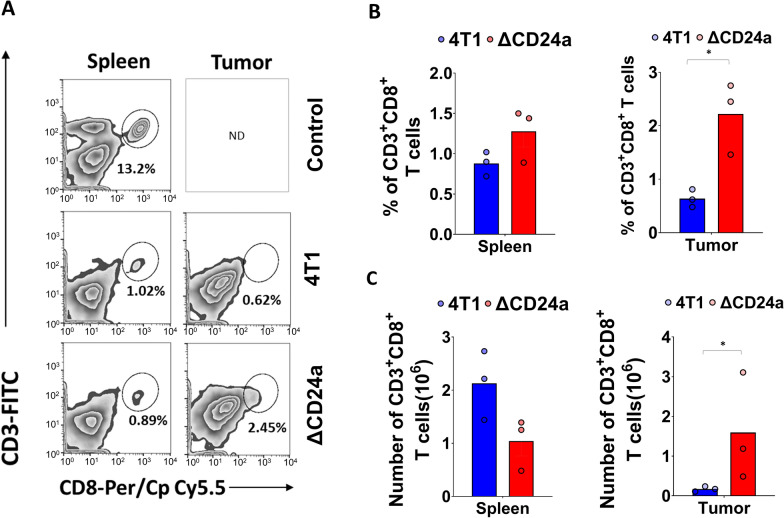
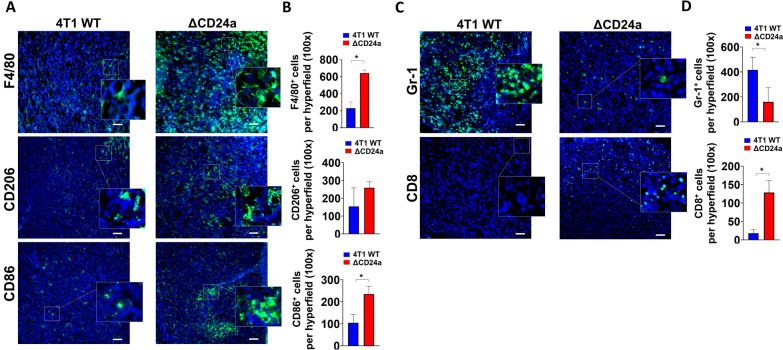
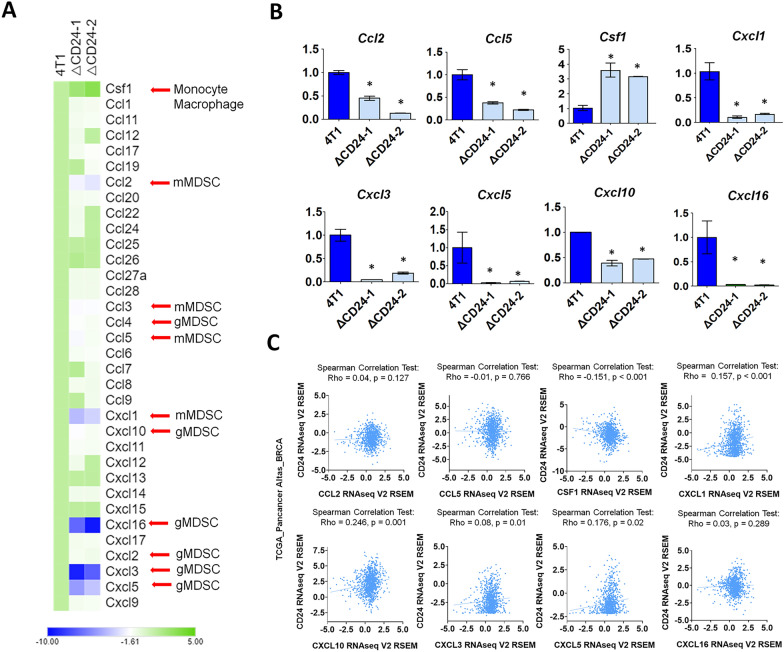
Results: Knocking out CD24a significantly reduced tumor growth kinetics and prolonged mouse survival in vivo. Flow cytometry and IF analysis of tumor samples revealed that CD24a loss significantly promoted the infiltration of M1 macrophages and cytotoxic CD8+ T cells into the TME while reducing the recruitment and expansion of granulocytic MDSCs (gMDSCs). In vitro coculture experiments showed that CD24a deficiency significantly enhanced macrophage-mediated phagocytosis and CD8⁺ T cell-mediated cytotoxicity, effects that were partially reversed by re-expression of CD24a. Moreover, in vivo depletion of macrophages and CD8+ T cells reverted the delayed tumor growth caused by CD24a knockout, underscoring their critical role in tumor growth suppression associated with CD24a knockout. 3D mapping of immune cells in the TME confirmed the anti-tumor immune landscape in the CD24a knockout 4T1 tumors. Furthermore, in vitro analysis showed that CD24a loss upregulated macrophage colony-stimulating factor expression while suppressed levels of CXCL1, CXCL5, and CXCL10, chemokines known to recruit gMDSCs, further providing a molecular basis for enhanced macrophage recruitment and diminished gMDSC accumulation.

Conclusions: Our findings suggest that CD24a may regulate immune suppression within the TNBC TME. Targeting CD24a enhances macrophage- and CD8⁺ T cell-mediated anti-tumor immune responses and is associated with a shift in the TME toward a more immunogenic state, thereby suppressing tumor growth. These results may support CD24 as a promising immunotherapeutic target for TNBC.

Keywords: CD24a; CD8+ T cells; CRISPR/Cas9 knockout; Macrophages; Triple-negative breast cancer; Tumor microenvironment.


Conflict of interest statement

Declarations. Ethics approval and consent to participate: All animal experiments received approval from the Animal Use Protocol Committee at China Medical University (CMUIACUC number: 2022-362) and were conducted in compliance with the National Institutes of Health (NIH) guidelines for the Care and Use of Laboratory Animals. Consent for publication: Not applicable. Competing interests: The authors have stated that they have no competing interests.

Figures

Fig. 1
Fig. 1
Depletion of macrophages and CD8+ T cells abolishes CD24a knockout-induced growth delay of 4T1 tumors. A The cytotoxicity effect of NK cells and CD8+ T cells on 4T1 cells. NK cells and CD8+ T cells were isolated from mouse spleen and purified as described in the Methods section 1.5 × 104 4T1 cells were incubated with NK cells and CD8+ T cells at an effector-to-target (E:T) ratio of 20:1 for 48 h. After incubation, cell viability was assessed using trypan blue exclusion staining to determine the extent of cytotoxicity. B The cytotoxicity effect of NK cells and CD8+ T cells on ΔCD24a cells. 1.5 × 104 ΔCD24a 4T1 cells were incubated with NK cells and CD8+ T cells at an E:T ratio of 20:1 for 48 h. Cell viability was similarly determined. **P < 0.005, ***P < 0.001. C Representative images of in vitro phagocytosis. Cancer cells were pre-labeled with Calcein-AM dye (green fluorescence), followed by coculturing with M1 macrophages for 4 h. M1 macrophages were prepared as described in the Methods section. Phagocytosis analysis was measured by comparing the percentage of cancer cell-engulfing macrophages in the 4T1/M1 macrophages group and ΔCD24a 4T1/macrophage group under a fluorescence microscope (100 × magnification). Scale bar: 40 μm. *P < 0.05. D Tumor growth kinetics of 4T1 tumor-bearing mice receiving anti-CD8α, anti-CSF1R, or control IgG (n = 5). E Endpoint tumor weight analysis of 4T1 tumor-bearing mice treated with anti-CD8α, anti-CSF1R, or control IgG (n = 5). *P < 0.05. F Tumor growth kinetics of ΔCD24a 4T1 tumor-bearing mice receiving anti-CD8α, anti-CSF1R, or control IgG (n = 5). *P < 0.05. G Endpoint tumor weight analysis of ΔCD24a 4T1 tumor-bearing mice treated with anti-CD8α, anti-CSF1R or control IgG (n = 5). *P < 0.05
Fig. 2
Fig. 2
Knockout of CD24a significantly impairs tumor growth and prolongs the mouse survival in a 4T1 BALB/c syngeneic model. A Tumor growth kinetics of ΔCD24a 4T1 tumor-bearing (n = 5) and WT 4T1-bearing mice (n = 5). The abscissa shows days after tumor cell injection. **P < 0.01. B Lung metastasis analysis in 4T1 and ΔCD24a 4T1 tumor-bearing mice. Left Panel: Representative H&E staining images of lung sections from 4T1 and ΔCD24a 4T1 tumor-bearing mice, showing metastatic nodules (labeled "T"). Right Panel: Quantification of lung metastatic nodules in 4T1 and ΔCD24a 4T1 tumor-bearing mice. C Images of resected tumors and spleens from ΔCD24a 4T1 tumor-bearing (n = 5) and 4T1 tumor-bearing mice (n = 5). Spleens resected from tumor-free mice were also shown. D The weight of tumors and spleens are shown in histograms. E Kaplan–Meier survival analysis of ΔCD24a 4T1 tumor-bearing mice and 4T1 tumor-bearing mice. Log rank test: P = 0.002. F Tumor growth kinetics of ΔCD24a 4T1 tumor-bearing (n = 5) and 4T1 tumor-bearing mice (n = 5) during the survival experiment. All ΔCD24a 4T1 tumor-bearing survived to the endpoint of the experiment
Fig. 3
Fig. 3
The loss of CD24a significantly enhances macrophage infiltration into the TME. A Flow cytometry analysis of tumor-infiltrated CD11b+ F4/80+ macrophages in the tumors resected from 4T1 tumor-bearing mice and ΔCD24a 4T1 tumor-bearing mice (n = 3). Cells were isolated from tumors using protocol described in the Method section. The isolated cells were stained with FITC-conjugated anti-CD11b antibody and PerCp/Cyanine5.5-conjugated anti-F4/80 antibody, followed by flow cytometry analysis. B The percentages and C numbers of CD11b+F4/80+ macrophages in the tumors were analyzed with FlowJo software and presented in histograms. *P < 0.05. D Flow cytometry analysis of the presence of CD49b+ NK cells in the tumors and spleens from 4T1 tumor-bearing mice and ΔCD24a 4T1 tumor-bearing mice (n = 3). Cells isolated from the spleens and tumors were stained with FITC-conjugated anti-CD49b antibody. E Histograms show mean percentage and F, number of CD49b.+ NK cells in the spleens and tumors resected from 4T1 tumor-bearing mice and ΔCD24a 4T1 tumor-bearing mice. *P < 0.05
Fig. 4
Fig. 4
CD24a loss significantly enhances CD8+ T cells infiltration into tumors. A Flow cytometry was used to analyze CD8⁺ T cell infiltration in the spleens and tumors resected from 4T1 tumor-bearing mice and ΔCD24a 4T1 tumor-bearing mice (n = 3). Cells were isolated from spleens and tumors using the protocol described in the Method section. The isolated cells were stained with FITC-conjugated anti-CD3 antibody and PerCp/Cyanine5.5-conjugated anti-CD8 antibody, followed by flow cytometry analysis. B Histograms show mean percentage and C cell number of CD8+ T cells in the spleens and tumors resected from 4T1 tumor-bearing mice and ΔCD24a 4T1 tumor-bearing mice. *P < 0.05
Fig. 5
Fig. 5
Knocking out CD24a reduces granulocytic and monocytic myeloid-derived suppressor cells (MDSCs) in the spleens and decreases the recruitment of gMDSCs into the TME. A Flow cytometry analysis of the distribution of the CD11+Ly6G+ Ly6C granulocytic MDSCs (gMDSCs), and CD11b+Ly6C+Ly6G monocytic MDSCs (mMDSCs) (n = 3) in the bone marrows, spleens, and tumors from 4T1 tumor-bearing mice and ΔCD24a 4T1 tumor-bearing mice (n = 3). Cells were prepared using the protocol described in the Method section. The isolated cells were stained with FITC-conjugated anti-CD11b, PE-Cy7-conjugated Ly6C+, and PE-conjugated Ly6G+ antibodies. CD11b+ cells were first gated, followed by dot plot analysis using Flow Jo software to identify CD11b+Ly6C+Ly6G and CD11+Ly6G+Ly6C double-positive populations, respectively. B Histograms show mean percentage of gMDSCs population in the tumors, spleens, and bone marrows from ΔCD24a 4T1 tumor-bearing (n = 3) and 4T1 tumor-bearing mice (n = 3). C Histograms displayed the cell number of gMDSCs in the tumors, spleens, and bone marrows resected from tumor-bearing mice. D Histograms show mean percentage of mMDSCs population in the tumors, spleens, and bone marrows from ΔCD24a 4T1 tumor-bearing (n = 3) and 4T1 tumor-bearing mice (n = 3). E Histograms display the cell number of mMDSCs in tumors, spleens, and bone marrows resected from tumor-bearing mice
Fig. 6
Fig. 6
IF staining reveals increased CD86+ M1 macrophages and CD8+ T cells infiltration in the TME of ΔCD24a 4T1 tumors. A Representative immunofluorescence (IF) images of tumor sections showing F4/80⁺, CD206⁺, and CD86⁺ macrophages. The enlarged box highlights the positively stained cells. Frozen sections of ΔCD24a 4T1 tumors and 4T1 tumors were prepared from OCT-embedded frozen tumor tissues for IF staining. Scale bar, 50 μm. B Quantitative analysis of IF images for F4/80+ macrophages, CD206+ macrophages, and CD86+ macrophages in tumor sections. P < 0.05. C The representative tumor section IF images of Gr-1+ MDSCs and CD8+ T cells. Scale bar, 50 μm. D Quantitative analysis of IF images for Gr-1+ MDSCs and CD8.+ T cells in tumor sections. P < 0.05
Fig. 7
Fig. 7
Reconstruction of three-dimensional images confirms macrophages and CD8+ T cells infiltration in the TME of ΔCD24a 4T1 tumors. A Flow chart of the reconstruction of 3D images of tumors. B Fluorescence images of F4/80+ macrophages and Gr-1+ MDSCs within 4T1 and ΔCD24a 4T1 tumors. C, D Quantitative fluorescence signals of F4/80+ macrophages and Gr-1+ MDSCs within 4T1 and ΔCD24a 4T1 tumors. *P < 0.05. E Fluorescence images of F4/80+ macrophages and CD8+ T cells within 4T1 and ΔCD24a 4T1 tumors. F, G Quantitative fluorescence signals of F4/80+ macrophages and CD8+ T cells within 4T1 and ΔCD24a 4T1 tumors. Bottom panels of B and E are enlarged images of the respective frame boxes. *P < 0.05
Fig. 8
Fig. 8
The knockout of CD24a modulates the expression of chemokines crucial for the recruitment of macrophages, and mMDSCs/gMDSCs into the TME. A Exon array analysis revealed Chemokine expression profiles between 4T1, ΔCD24-1, and ΔCD24-2 cells. RNA was extracted from 4T1 and ΔCD24a 4T1 cells. The transcriptome analysis was conducted using the Affymetrix GeneChip Human Exon 1.0 ST Array. A heatmap was generated using Transcriptome Analysis Console (TAC) Software. B qRT-PCR analysis of chemokine expressions relevant to the recruitment of macrophages and MDSCs. The expression levels of the chemokine genes Ccl2, Ccl5, Csf1, Cxcl1, Cxcl3, Cxcl5, Cxcl10, and Cxcl16 were shown. *P < 0.05. C Spearman correlation analysis of chemokines and CD24 expression in a clinical breast cancer database

Similar articles

References

    1. Kristiansen G, Sammar M, Altevogt P. Tumour biological aspects of CD24, a mucin-like adhesion molecule. J Mol Histol. 2004;35(3):255–62. - PubMed
    1. Fang X, Zheng P, Tang J, Liu Y. CD24: from a to z. Cell Mol Immunol. 2010;7(2):100–3. - PMC - PubMed
    1. Altevogt P, Sammar M, Hüser L, Kristiansen G. Novel insights into the function of CD24: a driving force in cancer. Int J Cancer. 2021;148(3):546–59. - PubMed
    1. Carrion C, Guérin E, Gachard N, le Guyader A, Giraut S, Feuillard J. Adult bone marrow three-dimensional phenotypic landscape of B-cell differentiation. Cytometry B Clin Cytom. 2019;96(1):30–8. - PubMed
    1. Zhang X, Yu C, Liu JQ, Bai XF. Dendritic cell expression of CD24 contributes to optimal priming of T lymphocytes in lymph nodes. Front Immunol. 2023;14:1116749. - PMC - PubMed