. 2025 Aug 10;150(1):17.
doi: 10.1007/s00401-025-02919-x.

Brain transcriptomics highlight abundant gene expression and splicing alterations in non-neuronal cells in aFTLD-U

Affiliations

Brain transcriptomics highlight abundant gene expression and splicing alterations in non-neuronal cells in aFTLD-U

Sara Alidadiani et al. Acta Neuropathol. .

Abstract

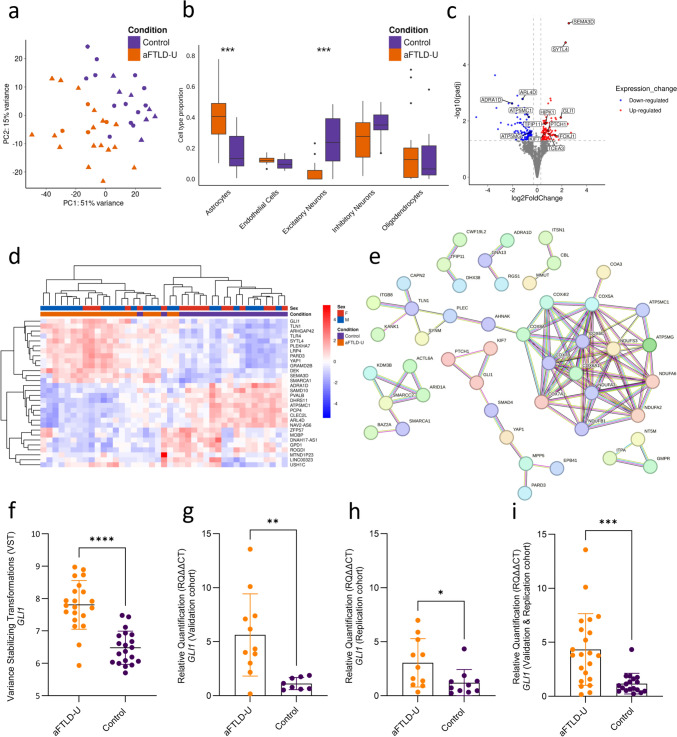
Atypical frontotemporal lobar degeneration with ubiquitin-positive inclusions (aFTLD-U) is a rare cause of frontotemporal lobar degeneration (FTLD), characterized postmortem by neuronal inclusions of the FET family of proteins (FTLD-FET). The recent discovery of TAF15 amyloid filaments in aFTLD-U brains represents a significant step toward improved diagnostic and therapeutic strategies. However, our understanding of the etiology of this FTLD subtype remains limited, which severely hampers translational research efforts. To explore the transcriptomic changes in aFTLD-U, we performed bulk RNA sequencing on the frontal cortex tissue of 21 aFTLD-U patients and 20 control individuals. Cell-type deconvolution revealed loss of excitatory neurons and a higher proportion of astrocytes in aFTLD-U relative to controls. Differential gene expression and co-expression network analysis, adjusted for the shift in cell-type proportions, showed dysregulation of mitochondrial pathways, transcriptional regulators, and upregulation of the Sonic hedgehog (Shh) pathway, including the GLI1 transcription factor, in aFTLD-U. Overall, oligodendrocyte and astrocyte-enriched genes were significantly over-represented among the differentially expressed genes. Differential splicing analysis confirmed the dysregulation of non-neuronal cell types with significant splicing alterations, particularly in oligodendrocyte-enriched genes, including myelin basic protein (MBP), a crucial component of myelin. Immunohistochemistry in frontal cortex brain tissue also showed reduced myelin levels in aFTLD-U patients compared to controls. Together, these findings highlight a central role for glial cells, particularly astrocytes and oligodendrocytes, in the pathogenesis of aFTLD-U, with disruptions in mitochondrial activity, RNA metabolism, Shh signaling, and myelination as possible disease mechanisms. This study offers the first transcriptomic insight into aFTLD-U and presents new avenues for research into FTLD-FET.

Keywords: Glial cells; Mitochondria; Sonic hedgehog signaling; Splicing; Transcriptomics; aFTLD-U.


Conflict of interest statement

Declarations. Conflict of interest: Dr. Rademakers receives invention royalties from a patent related to progranulin. Dr. Mackenzie is a member of the Scientific Advisory Board of Prevail Therapeutics and receives invention royalties from a patent related to progranulin. Drs. Rademakers and De Coster are inventors on a patent filed concerning diagnostic applications in aFTLD-U. Ethical approval and consent to participate: This study was approved by the University of Antwerp and Mayo Clinic Institutional Review Boards. The collection of tissue samples was approved by the Mayo Clinic Institutional Review Board. All autopsies were obtained after consent by the legal next-of-kin or someone legally authorized to make this decision.

Figures

Fig. 1
Fig. 1
Transcriptomic analyses in aFTLD-U versus controls. (a) Principal component (PC) analyses of frontal cortex bulk transcriptome data in 21 aFTLD-U patients (orange) and 20 control individuals (purple). Females are indicated with a circle, and males with a triangle. (b) Cell-type deconvolution shows estimated proportions of five cell types by CIBERSORTx (astrocytes, endothelial cells, excitatory neurons, inhibitory neurons, and oligodendrocytes). Wilcoxon rank-sum test, Bonferroni adjustment-p value (***P ≤ 0.001) (c) Volcano plot representing the differentially expressed genes in aFTLD-U patients versus controls, with adjustment for cell-type proportions. The fold change is presented in a log2 scale at the x-axis, while the adjusted P value is presented on the y-axis on a − log10 scale. (d) Heat map of the top 30 most significant genes from the differential gene expression analyses with adjustment for cell-type proportions. (e) STRING protein–protein interaction (PPI) network analysis on the DEGs. Disconnected nodes and nodes with only two connections are removed. We used a full STRING network; the edges represent both functional and physical protein associations. Line color indicates the type of interaction evidence. All colored nodes represent query proteins and the first shell of interactors. (f) Variance-stabilized transformed (VST) expression values of GLI1 from bulk RNA sequencing data showed significantly higher expression in aFTLD-U patients compared to controls (t test, p value < 0.0001). (g) Relative quantification (RQ) values from qPCR validation for GLI1 showed an increased level of GLI1 in aFTLD-U patients compared to the controls (t test, p value = 0.0042). (h) Relative quantification (RQ) values from qPCR replication of GLI1 expression, confirming increased expression in aFTLD-U patients (Mann–Whitney U test, p value = 0.0295). (i) A combined analysis of the validation and replication cohorts for GLI1 expression confirmed increased expression in aFTLD-U patients (Mann–Whitney U test, p value = 0.0003). In all plots, each dot represents an individual sample, and the data are represented as mean ± SD
Fig. 2
Fig. 2
Splicing alteration in aFTLD-U versus controls. (a) Volcano plot of differentially spliced events in aFTLD-U versus controls adjusted by cell type proportions. In dark blue, events within a significant cluster (FDR < 0.05) and a |ΔPSI|≥ 5%. (b) STRING protein–protein interaction (PPI) network analysis on the significantly differentially spliced genes. Disconnected nodes and nodes with only two connections are removed. (c, d) Schematic representation of the splicing events observed in CLDND1 and MBP. Exons are represented as dark blue boxes, and splice junctions are shown as curved lines. Figure created with Biorender. Below each schematic, tables display the chromosomal coordinates of the splice junctions, and PSI values for aFTLD-U patients and controls are indicated in the table. (e) Combined data of the validation and replication cohorts for CLDND1 showed significant differences in splicing (chr3:98,521,442–98,522,849) between aFTLD-U patients and controls (t test, p value = 0.0077) (f) Combined data of the validation and replication cohorts for MBP showed significant differences in splicing (chr18:76,984,894–76,988,877) between aFTLD-U patients and controls (t test, p value = 0.0087). In all plots, each dot represents an individual sample, and the data are represented as mean ± SD
Fig. 3
Fig. 3
MBP immunohistochemistry. Immunohistochemistry for deep frontal lobe myelin in (a) patient with aFTLD-U pathology, (b) control, and (c) patient with FTLD-TDP pathology, with values closest to the mean for their respective groups. (d) Comparison of the percentage surface area of white matter stained for MBP (MBP FC) showing significant reduction in aFTLD-U patients compared to controls (Dunn, Bonferroni-adjusted p value = 0.02) and FTLD-TDP patients (Dunn, Bonferroni-adjusted p value = 0.04) groups. The greater variability among aFTLD-U patients suggests heterogeneity in myelin loss severity. (ac) MBP immunohistochemistry; scale bar, 80 μm. (d) Each dot represents one individual. Data is shown as median with 95% confidence interval

References

    1. Al-Ayadhi LY (2012) Relationship between sonic hedgehog protein, brain-derived neurotrophic factor and oxidative stress in autism spectrum Disorders. Neurochem Res 37:394–400. 10.1007/S11064-011-0624-X/FIGURES/3 - PMC - PubMed
    1. Aleksander SA, Balhoff J, Carbon S, Cherry JM, Drabkin HJ, Ebert D et al (2023) The gene ontology knowledgebase in 2023. Genetics. 10.1093/GENETICS/IYAD031 - PMC - PubMed
    1. Anders S, Pyl PT, Huber W (2015) HTSeq–a Python framework to work with high-throughput sequencing data. Bioinformatics 31:166–169. 10.1093/BIOINFORMATICS/BTU638 - PMC - PubMed
    1. Bansal Y, Kuhad A (2016) Mitochondrial dysfunction in depression. Curr Neuropharmacol 14:610–618 - PMC - PubMed
    1. Baruzzo G, Hayer KE, Kim EJ, Di Camillo B, Fitzgerald GA, Grant GR (2016) Simulation-based comprehensive benchmarking of RNA-seq aligners. Nat Methods 14:135. 10.1038/NMETH.4106 - PMC - PubMed

LinkOut - more resources