. 2025 Aug 6:86:103815.
doi: 10.1016/j.redox.2025.103815. Online ahead of print.

Cathepsin S regulates ferroptosis sensitivity in hepatocellular carcinoma through the KEAP1-NRF2 signaling pathway

Affiliations

Cathepsin S regulates ferroptosis sensitivity in hepatocellular carcinoma through the KEAP1-NRF2 signaling pathway

Ru-Chen Xu et al. Redox Biol. .

Abstract

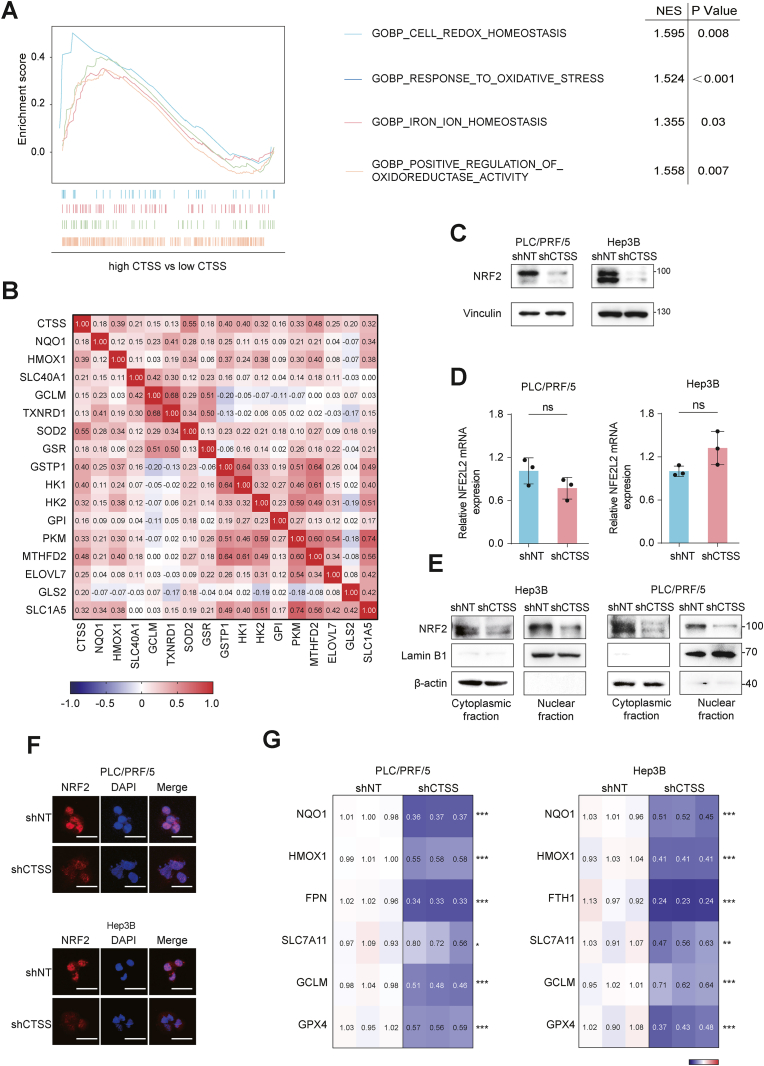
Ferroptosis is a newly discovered iron-dependent programmed cell death characterized by excess lipid peroxidation. It is emerging as a promising target for tumor therapies. In the present study, we first identify Cathepsin S (CTSS) as a novel ferroptosis regulator. CTSS is upregulated in ferroptosis-resistant hepatocellular carcinoma (HCC) cells, and suppression of CTSS sensitizes HCC cells to ferroptosis. Mechanistically, ferroptosis stress induces CTSS maturation and promotes the autophagy-lysosomal degradation of Kelch-like ECH-associated protein 1 (KEAP1). This process blocks KEAP1-dependent, ubiquitination-mediated degradation of nuclear factor E2-related factor 2 (NRF). Consequently, the accumulated NRF2 translocates from the cytoplasm to the nucleus and drives the transcription of anti-ferroptosis genes. In vivo study reveals that CTSS depletion, achieved through either shRNA or the specific inhibitor LY3000328, in combination with a ferroptosis inducer, inhibits HCC tumor growth in orthotopic xenograft mouse models. In conclusion, the above data suggest that CTSS can potentiate ferroptosis in HCC cells and may be a therapeutic target to overcome ferroptosis resistance in HCC patients.

Keywords: CTSS; HCC; Kelch-like ECH-associated protein 1; LY3000328; Nuclear factor E2-related factor 2.


Conflict of interest statement

Declaration of competing interest The authors declare that they have no known competing financial interests or personal relationships that could have appeared to influence the work reported in this paper.

Figures

Image 1
Graphical abstract
Fig. 1
Fig. 1
CTSS is upregulated in erastin-resistant HCC cells, and ferroptosis promotes the maturation of CTSS. (A) A schematic diagram of the construction of erastin-resistant HCC cells. (B) Erastin-resistant Hepa1-6 cells were validated by CCK-8 assay. (C) Volcano plot of differential gene analysis between HepaER cells and wild-type Hepa1-6 cells from RNA sequencing data. (D) Cathepsin family genes mRNA expression in HepaER cells and wild-type Hepa1-6 cells. (E) Western blot analysis of CTSS protein expression in the indicated cells. (F) CTSS mRNA expression in RSL3-resistant cells and parental control cells. (G) Correlation between CTSS expression and erastin sensitivity based on the HCC cell lines from Cancer Therapeutics Response Portal (CTRP) database. (H) CTSS mRNA expression in tumor and adjacent normal tissue samples from LIHC data set in TCGA database. (I) qRT-PCR analysis of CTSS mRNA expression in matched tumor and adjacent normal tissues from spontaneous HCC murine model. (J) Western blot analysis of CTSS protein expression in randomly selected 12-paired HCC tumors (T) and adjacent normal tissues (N). (K) Pro-CTSS and mature-CTSS protein expression levels from the indicated cells were assessed using Western blot. For erastin treatment, PLC/PRF/5 cells were pre-treated with 10 μM erastin for 24 h before collection, and Hep3B cells were pre-treated with 2 μM erastin for 24 h before collection. For FAC treatment, PLC/PRF/5 cells were pre-treated with 1000 μM FAC for 24 h before collection, and Hep3B cells were pre-treated with 500 μM FAC for 24 h before collection. (L) Western blot analysis of pro-CTSS and mature-CTSS protein expression from the indicated cells. For erastin treatment, PLC/PRF/5 cells were pre-treated with 5 μM and 10 μM erastin for 24 h before collection, and Hep3B cells were pre-treated with 1 μM and 2 μM erastin for 24 h before collection. For Fer-1 and Lx-1 treatment, PLC/PRF/5 cells and Hep3B cells were pre-treated with 10 μM Fer-1 and Lx-1 for 24 h before collection. All data are acquired from at least three independent experiments and presented as the mean ± SD. ∗p < 0.05, ∗∗p < 0.01, ∗∗∗p < 0.001.
Fig. 2
Fig. 2
CTSS knockdown sensitizes HCC cells to ferroptosis. (A–B) The indicated cells were treated with increasing concentrations of erastin and RSL3 for 24 h, and the cell viability was measured by CCK-8 assay. (C) The morphological changes in the indicated cells untreated or treated with erastin for 24 h by an optical microscope. Red arrow indicated cell shrinkage. For erastin treatment, PLC/PRF/5 cells were pre-treated with 10 μM erastin for 24 h before observation, and Hep3B cells were pre-treated with 2 μM erastin for 24 h before observation. Scale bar, 50 μm. (D) The ratio of GSH/GSSH was measured in the indicated cells pre-treated with erastin for 24 h. (E) The levels of intracellular lipid peroxidation were detected by the C11-BODIPY probe. PLC/PRF/5 cells were pre-treated with 10 μM erastin for 24 h before collection, and Hep3B cells were pre-treated with 2 μM erastin for 24 h before collection. (F–G) The contents of MDA and 4-HNE were measured in the indicated cells. For erastin treatment, PLC/PRF/5 cells were pre-treated with 10 μM erastin for 24 h before collection, and Hep3B cells were pre-treated with 2 μM erastin for 24 h before collection. All data are acquired from at least three independent experiments and presented as the mean ± SD. ∗p < 0.05, ∗∗p < 0.01, ∗∗∗p < 0.001.
Fig. 3
Fig. 3
CTSS promotes NRF2 translocation into the nucleus and activation. (A) Gene Set Enrichment Analysis (GSEA) between high CTSS expression group and low CTSS expression group from LIHC data set with normalized enrichment score (NES) and nominal P value. (B) Correlation between CTSS expression and NRF2 downstream target genes from LIHC data set in TCGA database. (C) Western blot analysis of NRF2 protein expression in the indicated cells. (D) qRT-PCR analysis of NFE2L2 mRNA expression in the indicated cells. (E) Western blot analysis of NRF2 protein expression in cytoplasmic fraction and nuclear fraction from the indicated cells. (F) The intracellular NRF2 localization in the indicated cells was observed using fluorescent microscopy. Red: NRF2; Blue: DAPI. Scale bar, 50 μm. (G) qRT-PCR analysis of NRF2-targeted anti-ferroptosis genes mRNA expression in the indicated cells. The mRNA expression of targeted genes in CTSS knockdown cells was normalized to parental control cells as shown in the heatmap. All data are acquired from at least three independent experiments and presented as the mean ± SD. ∗p < 0.05, ∗∗p < 0.01, ∗∗∗p < 0.001.
Fig. 4
Fig. 4
CTSS knockdown facilitates degradation of NRF2 mediated by the K48-linked ubiquitination. (A) The half-life of NRF2 protein expression in CTSS knockdown cells and parental control cells was measured by western blot assay. HCC cells were treated with 20 μg/mL cycloheximide (CHX) for the indicated time before collection. (B) Western blot analysis of NRF2 protein expression in the indicated cells untreated or treated with MG-132. For MG-132 treatment, PLC/PRF/5 and Hep3B cells were pre-treated with 20 μM MG-132 for 8 h before collection. (C) The endogenous ubiquitination levels of NRF2 in the indicated cells were measured by western blot assay. HCC cells were pre-treated with 20 μM MG-132 for 8 h before being lysed and anti-NRF2 primary antibodies were added, followed by immunoblotting with anti-ubiquitin antibody. (D) The exogenous ubiquitination levels of NRF2 in HEK-293T cells were measured by western blot assay. HEK-293T cells were co-transfected with the indicated plasmids. After 48 h of transfection, 20 μM MG-132 was added for 8 h before being lysed and immunoprecipitated with anti-MYC primary antibodies, followed by immunoblotting with anti-HA antibody. (E–F) The endogenous K48-linked and K63-linked ubiquitination levels of NRF2 in the indicated cells were measured by western blot assay. HCC cells were pre-treated with 20 μM MG-132 for 8 h before being lysed, and anti-NRF2 primary antibodies were added, followed by immunoblotting with anti-K48-ubiquitin and K63-ubiquitin antibodies. (G) The exogenous K48-linked and K63-linked ubiquitination levels of NRF2 in HEK-293T cells were measured by western blot assay. HEK-293T cells were co-transfected with the indicated plasmids (HA-tagged K48-Ub and K64-Ub plasmids referred to other lysines were mutated into arginin except K48 or K63 residue). After 48 h of transfection, 20 μM MG-132 was added for 8 h before being lysed and immunoprecipitated with anti-MYC primary antibodies, followed by immunoblotting with anti-HA antibody. All data are acquired from at least three independent experiments and presented as the mean ± SD. ∗p < 0.05, ∗∗p < 0.01, ∗∗∗p < 0.001.
Fig. 5
Fig. 5
CTSS regulates the sensitivity to ferroptosis in HCC cells dependent on NRF2. (A–B) The indicated cells were pre-treated with 20 μM tert-Butylhydroquinone (tBHQ) for 24h, followed by treatment with increasing concentrations of erastin and RSL3 for 24 h, and the cell viability was measured by CCK-8 assay. (C) The morphological changes in the indicated cells by an optical microscope. PLC/PRF/5 and Hep 3B cells were pre-treated with erastin, and untreated or treated with tBHQ for 24 h. Red arrow indicated cell shrinkage. Scale bar, 50 μm. (D) The ratio of GSH/GSSH was measured in the indicated cells pre-treated with erastin. For tBHQ treatment, cells were pre-treated with 20 μM tBHQ for 24h before collection. (E) The contents of MDA were measured in the indicated cells pre-treated with 20 μM tBHQ for 24h. For erastin treatment, PLC/PRF/5 cells were pre-treated with 10 μM erastin for 24 h before collection, and Hep3B cells were pre-treated with 2 μM erastin for 24 h before collection. (F) The indicated cells were treated with increasing concentrations of erastin for 24 h and the cell viability was measured by CCK-8 assay. All data are acquired from at least three independent experiments and presented as the mean ± SD. ∗p < 0.05, ∗∗p < 0.01, ∗∗∗p < 0.001.
Fig. 6
Fig. 6
CTSS binds to KEAP1 and disrupts the interaction between KEAP1 and NRF2. (A) Western blot analysis of KEAP1 protein expression in the indicated cells. (B) Western blot analysis of NRF2 and KEAP1 protein expression in the indicated cells. For construction of KEAP1 knockdown HCC cells, KEAP1-siRNA was transfected into HCC cells for 48 h before collection. (C) The endogenous ubiquitination levels of NRF2 in the indicated cells were measured in the indicated cells transfected with KEAP1-siRNA for 48 h by western blot assay. HCC cells were pre-treated with 20 μM MG-132 for 8 h before being lysed, and anti-NRF2 primary antibodies were added, followed by immunoblotting with anti-ubiquitin antibody. (D) The endogenous K48-linked ubiquitination levels of NRF2 in the indicated cells transfected with KEAP1-siRNA for 48 h were measured by western blot assay. HCC cells were pre-treated with 20 μM MG-132 for 8 h before being lysed, and anti-NRF2 primary antibodies were added, followed by immunoblotting with anti-K48-ubiquitin antibody. (E) Interaction between endogenous CTSS and KEAP1 was detected by Co-IP. Cells were untreated with erastin, lysed and immunoprecipitated with anti-KEAP1 antibody, followed by immunoblotting with anti-CTSS antibody. Reversely, cells were lysed and immunoprecipitated with anti-CTSS antibody, followed by immunoblotting with anti-KEAP1 antibody. (F) The colocalization between CTSS and KEAP1 was detected by immunofluorescence staining. Red: CTSS. Green: KEAP1. Blue: DAPI. Scale bar, 20 μm. (G) Interaction between endogenous KEAP1 and NRF2 in the indicated cells untreated or treated with erastin was detected by Co-IP. For erastin treatment, PLC/PRF/5 cells were pre-treated with 10 μM erastin for 24 h before collection, and Hep3B cells were pre-treated with 2 μM erastin for 24 h before collection. Cells were lysed and immunoprecipitated with anti-KEAP1, followed by immunoblotting with anti-NRF2 antibody. Reversely, cells were lysed and immunoprecipitated with anti-NRF2, followed by immunoblotting with anti-KEAP1 antibody. (H) Interaction between exogenous KEAP1 and NRF2 in HEK-293T cells untreated or treated with erastin was detected by Co-IP. HEK-293T cells were co-transfected with the indicated plasmids. After 48 h of transfection, 2 μM erastin was added for 24 h before being lysed and immunoprecipitated with anti-MYC primary antibodies, followed by immunoblotting with anti-His antibody. Reversely, cells were lysed and immunoprecipitated with anti-His, followed by immunoblotting with anti-MYC antibody. All data are acquired from at least three independent experiments and presented as the mean ± SD. ∗p < 0.05, ∗∗p < 0.01, ∗∗∗p < 0.001.
Fig. 7
Fig. 7
CTSS promotes lysosomal degradation of KEAP1. (A) qRT-PCR analysis of KEAP1 mRNA expression in the indicated cells untreated or treated with erastin. For erastin treatment, PLC/PRF/5 cells were pre-treated with 10 μM erastin for 24 h before collection, and Hep3B cells were pre-treated with 2 μM erastin for 24 h before collection. (B) Western blot analysis of KEAP1 protein expression in the indicated cells untreated or treated with erastin. PLC/PRF/5 cells were pre-treated with 10 μM, and Hep3B cells were pre-treated with 2 μM erastin for 24 h, followed by treatment with 20 μM chloroquine (CQ) for 24 h before collection. (C) Interaction between endogenous KEAP1 and LAMP1 in the indicated cells untreated or treated with erastin was detected by Co-IP. For erastin treatment, PLC/PRF/5 cells were pre-treated with 10 μM erastin for 24 h before collection, and Hep3B cells were pre-treated with 2 μM erastin for 24 h before collection. Cells were lysed and immunoprecipitated with anti-KEAP1, followed by immunoblotting with anti-LAMP1 antibody. Reversely, cells were lysed and immunoprecipitated with anti-LAMP1, followed by immunoblotting with anti-KEAP1 antibody. (D–E) The colocalization between KEAP1 and LAMP1 in the indicated cells untreated or treated with erastin was detected by immunofluorescence staining. Red: LAMP1. Green: KEAP1. Blue: DAPI. Scale bar, 20 μm. The co-localization of KEAP1 and CTSS was quantified using Mander's coefficient. (F) Interaction between endogenous KEAP1 and mature-CTSS in the indicated cells untreated or treated with erastin and FAC was detected by Co-IP. For erastin treatment, PLC/PRF/5 cells were pre-treated with 10 μM erastin for 24 h before collection, and Hep3B cells were pre-treated with 2 μM erastin for 24 h before collection. For FAC treatment, PLC/PRF/5 cells were pre-treated with 1000 μM FAC for 24 h before collection, and Hep3B cells were pre-treated with 500 μM FAC for 24 h before collection. (G) The indicated cells were treated with increasing concentrations of erastin for 24 h, and the cell viability was measured by CCK-8 assay. (H) Western blot analysis of exogenous CTSS and KEAP1 protein expression in the indicated cells. HEK-293T cells were co-transfected with the indicated plasmids. After 48 h of transfection, 2 μM erastin was added for 24 h before being lysed. All data are acquired from at least three independent experiments and presented as the mean ± SD. ∗p < 0.05, ∗∗p < 0.01, ∗∗∗p < 0.001.
Fig. 8
Fig. 8
CTSS inhibition augments the antitumor activity of erastin in vivo. (A–B) BALB/c nude mice were transplanted with PLC/PRF/5/shNT or PLC/PRF/5/shCTSS cells. At the 14th day after implantation, mice were intraperitoneally injected with 15 mg/kg erastin or normal saline every other day. On the 28th day after implantation, they were sacrificed, and tumors were separated. (C–D) Tumor volumes and weights were measured. (E–H) Immunohistochemistry analysis of 4HNE, CD71, NRF2, and KEAP1 of tumor xenografts. Scale bar, 20 μm. All data are acquired from at least three independent experiments and presented as the mean ± SD. ∗p < 0.05, ∗∗p < 0.01, ∗∗∗p < 0.001.

References

    1. Bray F., Laversanne M., Sung H., et al. Global cancer statistics 2022: GLOBOCAN estimates of incidence and mortality worldwide for 36 cancers in 185 countries. CA Cancer J. Clin. 2024;74(3):229–263. doi: 10.3322/caac.21834. - DOI - PubMed
    1. Villanueva A. Hepatocellular carcinoma. N. Engl. J. Med. 2019;380(15):1450–1462. doi: 10.1056/NEJMra1713263. - DOI - PubMed
    1. Dixon S.J., Lemberg K.M., Lamprecht M.R., et al. Ferroptosis: an iron-dependent form of nonapoptotic cell death. Cell. 2012;149(5):1060–1072. doi: 10.1016/j.cell.2012.03.042. - DOI - PMC - PubMed
    1. Yagoda N., von Rechenberg M., Zaganjor E., et al. RAS-RAF-MEK-dependent oxidative cell death involving voltage-dependent anion channels. Nature. 2007;447(7146):864–868. doi: 10.1038/nature05859. - DOI - PMC - PubMed
    1. Friedmann Angeli J.P., Schneider M., Proneth B., et al. Inactivation of the ferroptosis regulator Gpx4 triggers acute renal failure in mice. Nat. Cell Biol. 2014;16(12):1180–1191. doi: 10.1038/ncb3064. - DOI - PMC - PubMed

LinkOut - more resources