. 2025 Oct:86:103803.
doi: 10.1016/j.redox.2025.103803. Epub 2025 Aug 5.

Isoquercitrin mitigates intestinal ischemia-reperfusion injury by regulating intestinal flora and inhibiting NLRP3 inflammasome activation

Affiliations

Isoquercitrin mitigates intestinal ischemia-reperfusion injury by regulating intestinal flora and inhibiting NLRP3 inflammasome activation

Hui Xu et al. Redox Biol. 2025 Oct.

Abstract

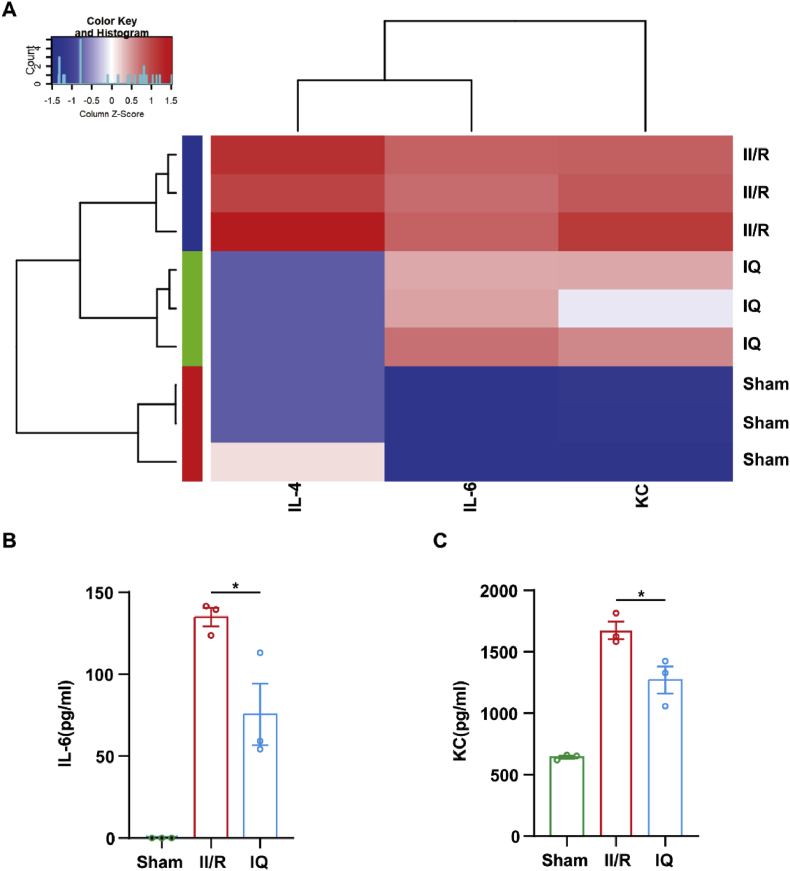
Intestinal ischemia-reperfusion (II/R) injury, frequently observed in clinical emergencies such as trauma, infection, and transplantation, leads to severe epithelial necrosis, loss of villi, and alarmingly high mortality rates (50 %-90 %), yet current pharmaceutical treatments largely prove ineffective. This study employs network pharmacology alongside in vivo and in vitro experiments to explore the potential of isoquercitrin, a flavonoid abundant in various dietary sources and known for its anti-inflammatory and antioxidant properties, in mitigating intestinal II/R injury. We found that isoquercitrin significantly reinforced the integrity of the intestinal barrier and markedly alleviated damage associated with II/R injury. Additionally, it enhanced the intestinal microbiota structure by promoting microbial diversity and supporting beneficial bacterial populations. According to network pharmacology analyses, isoquercitrin may prevent II/R injury by modulating redox-related pathways and regulating inflammatory responses mediated by the NLRP3 inflammasome. This protective effect is evidenced by reduced levels of reactive oxygen species (ROS) and malondialdehyde (MDA), as well as an increased GSH/GSSG ratio and enhanced superoxide dismutase (SOD) activity. Isoquercitrin also inhibited NLRP3 inflammasome activation and decreased the expression of downstream factors, including Caspase-1, IL-1β, IL-6, and keratinocyte-derived cytokine (KC). The observed effects correlate with enhancement of nuclear translocation of nuclear factor erythroid 2-related factor 2 (Nrf2) and increased expression of heme oxygenase-1 (HO-1) in a dose-dependent manner, and these beneficial effects were abolished by both ML385 (an Nrf2 inhibitor) and siNrf2. Thus, activating the Nrf2/HO-1 signaling pathway is crucial to isoquercitrin's protective role in intestinal II/R injury. The present findings underscore the therapeutic potential of isoquercitrin in managing intestinal II/R injury.

Keywords: Inflammatory cytokines; Intestinal flora; Intestinal ischemia-reperfusion; Isoquercitrin; Nrf2/HO-1.


Conflict of interest statement

Declaration of competing interest The authors declare that they have no known competing financial interests or personal relationships that could have appeared to influence the work reported in this paper.

Figures

Image 1
Graphical abstract
Fig. 1
Fig. 1
Model construction. (A) Mouse model with II/R injury. i.p., intraperitoneal; q.d., once a day; SMA, superior mesenteric artery. (B) Cell model with oxygen glucose deprivation and reperfusion (OGD/R). HG, high glucose; NG, no glucose.
Fig. 2
Fig. 2
IQ attenuated II/R-induced intestinal damage. (A) Representative laser scatter plots of intestinal tissue in the II/R models. (B) H&E staining of intestinal tissue sections from mouse models. Scale bars: 200 μm (top), 50 μm (bottom). (C) Chiu's scores of intestinal tissue injury (n = 6 pooled mice per group; F(4, 25) = 64.29). (D) Intestinal tissue weight loss ratio in mouse models (n = 6–8 pooled mice per group, F(4, 30) = 22.24). (E) Viability of IEC-6 cells treated with IQ under NC or OGD/R conditions. Salidroside (Sal) served as the experimental positive control (n = 6 biologically independent samples per group, NC: F(6, 35) = 2.287, OGD: F(6, 35) = 23.61). (F) Viability of Caco-2 cells treated with IQ under NC or OGD/R conditions (n = 8 biologically independent samples per group, NC: F(5, 42) = 1.775, OGD: F(5, 42) = 21.29). Data were pooled from at least three independent experiments. Values are shown as mean ± SEM. ∗∗P < 0.01, ∗∗∗P < 0.001.
Fig. 3
Fig. 3
IQ attenuated damage to the intestinal barrier. (A) Western blot images of ZO-1 in intestinal tissue. (B) Quantitative analysis of intestinal ZO-1 protein levels (representative data with n = 3–4 pooled mice per group, F(4, 13) = 24.79). (C) Western blot images of ZO-1 in IEC-6 cells. (D) Quantitative analysis of ZO-1 protein levels in IEC-6 cells (n = 3 biologically independent samples per group, F(3, 8) = 40.80). (E) Western blot images of ZO-1 in Caco-2 cells. (F) Quantitative analysis of ZO-1 protein levels in Caco-2 cells (n = 3 biologically independent samples per group, F(3, 8) = 32.57). (G) Representative immunofluorescence images of ZO-1 (green) and DAPI (blue) staining in IEC-6 cells. Scale bar = 100 μm (H) Quantitative analysis of the ZO-1 immunofluorescence staining of IEC-6 cells (n = 6 biologically independent samples per group, F(3, 20) = 510.4). Data were pooled from at least three independent experiments. Values are shown as mean ± SEM. ∗P < 0.05, ∗∗P < 0.01, ∗∗∗P < 0.001.
Fig. 4
Fig. 4
Effects of IQ on the intestinal flora. (A) Relative abundance at the phylum level. (B) LEfSe of OTUs. (C) Alpha diversity indexes. (D) PCoA based on the altGower distance. Consistent results were obtained in three independent experiments; representative data are shown with n = 3–4 pooled mice per group. Values are shown as mean ± SEM.
Fig. 5
Fig. 5
Pharmacological analysis of the IQ-II/R network. (A) The chemical structure of IQ. (B) Venny figure. (C, D) Protein–protein interaction network. (E) GO enrichment analysis. (F) KEGG enrichment analysis. (G) Molecular docking of IQ-NLRP3. (H) Molecular docking of IQ-SRC.
Fig. 6
Fig. 6
Effects of IQ on the NLRP3 inflammasome. (A) Western blot images of NLRP3, Caspase-1, ASC, and IL-1β in intestinal tissue. (B) Western blot images of NLRP3, Caspase-1, ASC, and IL-1β in IEC-6 cells. (C) Quantitative analysis of NLRP3, Caspase-1, ASC, and IL-1β protein levels in intestinal tissue (representative data with n = 3–4 pooled mice per group; IL-1β: F(4, 13) = 10.46; NLRP3: F(4, 13) = 7.793; Caspase-1: F(4, 13) = 21.83; ASC: F(4, 13) = 12.64). (D) Quantitative analysis of NLRP3, Caspase-1, ASC, and IL-1β protein levels in IEC-6 cells (n = 3 biologically independent samples per group; IL-1β: F(3, 8) = 79.67; NLRP3: F(3, 8) = 40.04; Caspase-1: F(3, 8) = 19.92; ASC: F(3, 8) = 43.96). Data were pooled from at least three independent experiments. Values are shown as mean ± SEM. ∗P < 0.05, ∗∗P < 0.01, ∗∗∗P < 0.001.
Fig. 7
Fig. 7
Effects of IQ on the NLRP3 inflammasome in OGD/R-injured IEC-6 cells. (A) Representative immunofluorescence images of IL-1β (green) and DAPI (blue) staining. Scale bar = 100 μm (B) Representative immunofluorescence images of NLRP3 (green) and DAPI (blue) staining. Scale bar = 100 μm (C) Quantitative analysis of IL-1β immunofluorescence intensity (n = 3 biologically independent samples per group). (D) Quantitative analysis of NLRP3 immunofluorescence intensity (n = 6 biologically independent samples per group). Data were pooled from at least three independent experiments. Values are shown as mean ± SEM. ∗P < 0.05, ∗∗∗P < 0.001.
Fig. 8
Fig. 8
Effects of IQ on the peripheral blood inflammatory factors in mice. (A) Heatmap of serum cytokine levels in mice. (B) Quantitative analysis of serum IL-6 levels (n = 3 pooled mice per group). (C) Quantitative analysis of serum KC levels (n = 3 pooled mice per group). Data are representative of or pooled from three independent experiments. Values are expressed as mean ± SEM. ∗P < 0.05.
Fig. 9
Fig. 9
IQ inhibited oxidative stress. (A) The MDA level (F(4, 25) = 163.6) and (B) the GSH/GSSG ratio (F(4, 25) = 120.2) of the intestinal tissue (representative data with n = 6 pooled mice per group). (C) The intracellular ROS in IEC-6 cells determined by enzymatic assay. Salidroside (Sal) served as the experimental positive control (n = 6 biologically independent samples per group, F(5, 30) = 154.5). (D) Immunofluorescence detection of the intracellular ROS in IEC-6 cells. Scale bar = 100 μm (E) Quantitative analysis of the ROS-positive IEC-6 cells (n = 10 biologically independent samples per group, F(3, 36) = 211.6). (F) The intracellular ROS in Caco-2 cells determined by enzymatic assay (n = 6 biologically independent samples per group, F(3, 20) = 130.6). (G) Immunofluorescence detection of the intracellular ROS in Caco-2 cells. Scale bar = 100 μm (H) Quantitative analysis of ROS-positive Caco-2 cells (n = 5 biologically independent samples per group, F(3, 17) = 73.98). (I) The MDA level (F(3, 8) = 109.5), (J) the SOD activity (F(3, 8) = 59.98), and (K) the GSH/GSSG ratio (F(3, 8) = 141.6) in Caco-2 cells (n = 3 biologically independent samples per group) Data were pooled from at least three independent experiments. Values are expressed as mean ± SEM. ∗∗∗P < 0.001.
Fig. 10
Fig. 10
Effects of IQ on Nrf2. (A) Western blot images of Nrf2 in intestinal tissue. (B) Quantitative analysis of Nrf2 levels in intestinal tissue (nuclear: F(4,13) = 36.30; total: F(4,13) = 0.3981; n = 3–4 pooled mice per group; data are representative of three independent experiments). (C) Representative immunofluorescence images of Nrf2 (green) and nuclei (DAPI, blue) in IEC-6 cells. Scale bar = 100 μm. (D) Quantitative analysis of Nrf2 levels in IEC-6 cells based on immunofluorescence intensity (n = 5 biologically independent samples per group). (E) Western blot images of Nrf2 in IEC-6 cells. (F) Quantitative analysis of the Western blot results of Nrf2 levels in IEC-6 cells (cytosolic: F(3,8) = 0.5874; nuclear: F(3,8) = 72.32; total: F(3,8) = 1.635; n = 3 biologically independent samples per group). (G) Western blot images of Nrf2 in Caco-2 cells. (H) Quantitative analysis of Nrf2 protein levels in Caco-2 cells (cytosolic: F(3,8) = 62.46; nuclear: F(3,8) = 30.22; total: F(3,8) = 1.248; n = 3 biologically independent samples per group). Data were pooled from at least three independent experiments. Values are expressed as mean ± SEM. ∗P < 0.05, ∗∗P < 0.01, ∗∗∗P < 0.001.
Fig. 11
Fig. 11
Effects of IQ on HO-1. (A) Detection of HO-1 levels by HO-1 immunofluorescence staining (green) and DAPI staining (blue), scale bar = 100 μm (B) Quantitative analysis of HO-1 immunofluorescence staining in IEC-6 cells (n = 4 biologically independent samples per group). (C) Western blot images of HO-1 in IEC-6 cells. (D) Quantitative analysis of HO-1 protein levels in IEC-6 cells (n = 3 biologically independent samples per group, F(3,8) = 88.88). (E) Western blot images of HO-1 in Caco-2 cells. (F) Quantitative analysis of HO-1 protein levels in Caco-2 cells (n = 3 biologically independent samples per group, F(3,8) = 51.58). (G) Western blot images of HO-1 in intestinal tissue. (H) Quantitative analysis of HO-1 protein levels in intestinal tissue (n = 3–4 pooled mice per group, F(3,8) = 33.86). Data were pooled from at least three independent experiments. Values are expressed as mean ± SEM. ∗P < 0.05, ∗∗P < 0.01, ∗∗∗P < 0.001.
Fig. 12
Fig. 12
IQ could no longer alleviate the OGD/R injury in the presence of ML385. (A) Viability of IEC-6 cells treated with ML385 without IQ pretreatment (n = 6 biologically independent samples per group; NC: F(5,30) = 55.84; OGD: F(5,30) = 42.84). (B) Viability of IEC-6 cells treated with ML385 with IQ pretreatment (n = 6 biologically independent samples per group; NC: F(4,25) = 38.50; OGD: F(4,25) = 78.28). (C) Western blot images of HO-1, ZO-1, and total Nrf2 in IEC-6 cells. (D–F) Quantitative analysis of (D) HO-1 (F(3,8) = 108.9), (E) ZO-1 (F(3,8) = 110.6), and (F) total Nrf2 (F(3, 8) = 1.709) levels (n = 3 biologically independent samples per group). (G) Western blot images of Nrf2 in the nucleus and cytoplasm of IEC-6 cells. (H, I) Quantitative analysis of Nrf2 levels in the (H) nucleus (F(3,8) = 131.0) and (I) cytoplasm (F(3,8) = 30.95) of IEC-6 cells (n = 3 biologically independent samples per group). (J) Representative immunofluorescence images of intracellular ROS in IEC-6 cells (scale bar = 100 μm) (K) Quantitative analysis of intracellular ROS levels (n = 3 biologically independent samples per group, F(3,8) = 46.05). Data were obtained from at least three independent experiments. Values are expressed as mean ± SEM. ∗P < 0.05, ∗∗P < 0.01, ∗∗∗P < 0.001.
Fig. 13
Fig. 13
Nrf2 knockdown abolished IQ's protective effects against OGD/R injury in Caco-2 cells. (A–C) Knockdown of Nrf2 protein (A, B; F(3,12) = 248.8) and mRNA expression (C; F(3,12) = 20.63) using siNrf2 in Caco-2 cells was confirmed by Western blotting and RT-PCR (n = 4 biologically independent samples per group). (D–I) Western blot analysis of Nrf2 subcellular localization (nuclear: F(4,10) = 116.1; cytoplasmic: F(4,10) = 73.18), total Nrf2 (F(4,10) = 207.2), HO-1 (F(4,10) = 61.23), and ZO-1 (F(4,10) = 69.63) levels in siNrf2-transfected Caco-2 cells (n = 3 biologically independent samples per group). (J–L) Levels of MDA (J; F (4, 10) = 146.5), GSH/GSSG ratio (K; F (4, 10) = 221.7), and SOD activity (L; F (4, 10) = 96.21) in Caco-2 cells (n = 3 biologically independent samples per group). (M) Intracellular ROS levels determined by enzymatic assay (F(4,25) = 158.6; n = 6 biologically independent samples per group). (N) Quantification of intracellular ROS immunofluorescence (F(4,25) = 62.16; n = 6 biologically independent samples per group). (O) Representative immunofluorescence images of intracellular ROS in Caco-2 cells. Scale bar = 100 μm. Data were obtained from at least three independent experiments. Values are expressed as mean ± SEM. ns, not significant, ∗∗P < 0.01, ∗∗∗P < 0.001.

References

    1. Li Y., Feng D., Wang Z., Zhao Y., Sun R., Tian D., Liu D., Zhang F., Ning S., Yao J., Tian X. Ischemia-induced ACSL4 activation contributes to ferroptosis-mediated tissue injury in intestinal ischemia/reperfusion. Cell Death Differ. 2019;26(11):2284–2299. - PMC - PubMed
    1. Chassin C., Hempel C., Stockinger S., Dupont A., Kübler J.F., Wedemeyer J., Vandewalle A., Hornef M.W. MicroRNA-146a-mediated downregulation of IRAK1 protects mouse and human small intestine against ischemia/reperfusion injury. EMBO Mol. Med. 2012;4(12):1308–1319. - PMC - PubMed
    1. Wen S., Li X., Ling Y., Chen S., Deng Q., Yang L., Li Y., Shen J., Qiu Y., Zhan Y., Lai H., Zhang X., Ke Z., Huang W. HMGB1-associated necroptosis and kupffer cells M1 polarization underlies remote liver injury induced by intestinal ischemia/reperfusion in rats. FASEB J. 2020;34(3):4384–4402. - PubMed
    1. Feng D., Yao J., Wang G., Li Z., Zu G., Li Y., Luo F., Ning S., Qasim W., Chen Z., Tian X. Inhibition of p66Shc-mediated mitochondrial apoptosis via targeting prolyl-isomerase Pin1 attenuates intestinal ischemia/reperfusion injury in rats. Clin. Sci. (Lond.) 2017;131(8):759–773. - PubMed
    1. Acosta S. Epidemiology of mesenteric vascular disease: clinical implications. Semin. Vasc. Surg. 2010;23(1):4–8. - PubMed

MeSH terms

LinkOut - more resources