. 2025 Sep;301(9):110576.
doi: 10.1016/j.jbc.2025.110576. Epub 2025 Aug 8.

Small molecule agonist TPC2-A1-N increases intracellular Ca2+ independent of two-pore channels

Affiliations

Small molecule agonist TPC2-A1-N increases intracellular Ca2+ independent of two-pore channels

Robert T Mallmann et al. J Biol Chem. 2025 Sep.

Abstract

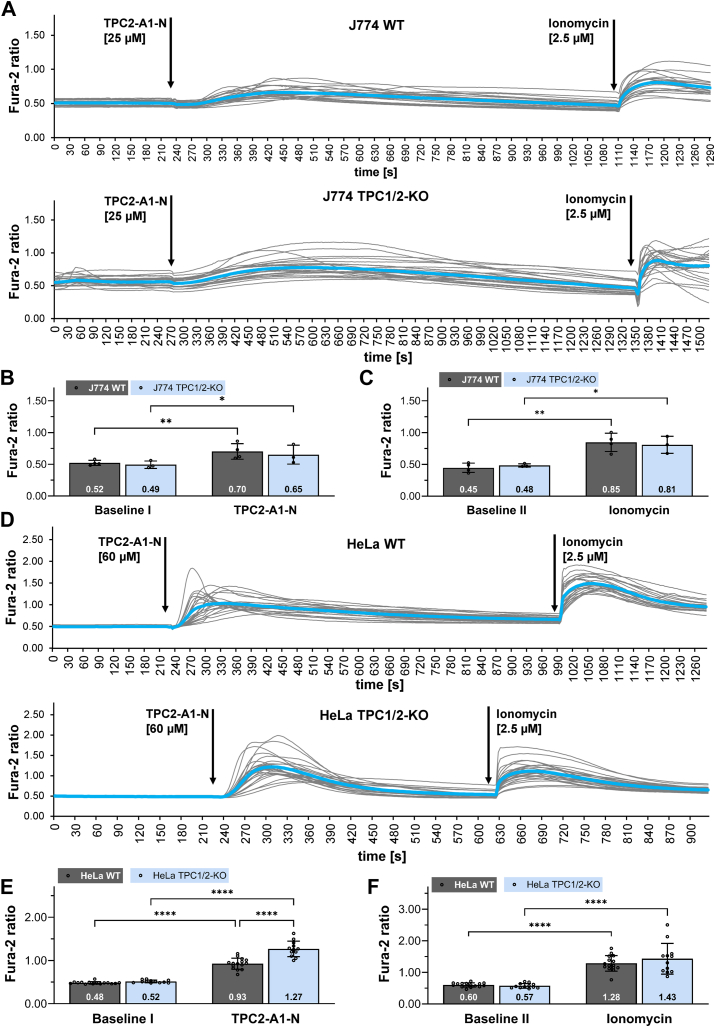
Two-pore channels (TPCs) constitute a small family of cation channels expressed in endo-lysosomal compartments. TPCs have been characterized as important constituents controlling Ca2+-mediated vesicular membrane fusion and fission, thereby regulating intracellular organelle trafficking. Two activators, nicotinic acid adenine dinucleotide phosphate and phosphatidylinositol-3,5-bisphosphate, induce ion flux through TPCs. The membrane-permeable small molecule activators TPC2-A1-N and TPC2-A1-P have been identified and postulated to mimic their action and to discriminate for a preferential selectivity either for Ca2+ or for Na+. This was observed only for TPC2 and was independent of nicotinic acid adenine dinucleotide phosphate-binding proteins. Here, we applied TPC2-A1-N and measured intracellular increase of Ca2+ and Na+ in mouse embryonic fibroblast, HeLa, and J774 cells. TPC2-A1-N did not only increase Ca2+ levels in WT but also in all cells with genetically inactivated TPCs. Depletion of Ca2+ from the endoplasmic reticulum (ER) via thapsigargin caused a massive reduction of the TPC2-A1-N induced Ca2+ elevation in all cell lines, indicating that ER plays a key role in this context. Furthermore, our results point to an inositol triphosphate receptor-independent TPC2-A1-N mediated Ca2+ release. Ca2+ depletion from ER was also observed by using an ER-targeted GCaMP6 construct. TPC2-A1-N also raised Na+ levels in mouse embryonic fibroblast cells deficient for TPC1 and TPC2. In summary, our results suggest that TPC2-A1-N induced Ca2+ and Na+ signals are independent of any TPC and that ER represents the major source of Ca2+.

Keywords: Ca(2+) measurement; NAADP; TPC; TPC-A1-N; calcium intracellular release; endo-lysosomal system; endoplasmic reticulum; endosome; intracellular trafficking; ion channel; two-pore channel.


Conflict of interest statement

Conflict of interest The authors declare that they have no conflicts of interest with the contents of this article.

Figures

Figure 1
Figure 1
TPC2-A1-N induced Ca2+ increase in MEF WT and TPC-deficient cells.A, single track Ca2+ recordings from 23 Fura-2 loaded WT, 24 TPC1-, 28 TPC2- and 20 TPC1/2-double KO MEF cells (gray lines correspond to each individual cell; mean Fura-2 ratio is shown as blue line). Fura-2 ratios were gathered in Ca2+-free Hank's balanced salt solution buffer. Following incubation with TPC2-A1-N 2.5 μM ionomycin was added. B, comparison of Fura-2 ratios at baseline levels and maximal Fura-2 ratios following treatment with TPC2-A1-N. C, comparison of Fura-2 ratios at baseline levels and maximal Fura-2 ratios after application of ionomycin. A-C,)mean values represent the average maximal Fura-2 ratios of N experiments per cell line. B and C, (MEF-WT (N = 6) MEF-TPC1-KO (N = 9) MEF-TPC2-KO (N = 6) MEF-TPC1/2-KO (N = 5); data are presented as mean ± SD. Two-way repeated measures ANOVA followed by Bonferroni’s multiple comparisons test. N = number of experiments; ∗p < 0.05, ∗∗p < 0.01, and ∗∗∗p < 0.001. TPC, two-pore channel.
Figure 2
Figure 2
TPC2-A1-N induced Ca2+ and Na+ increase in MEF WT and TPC-deficient cells.A, single track recordings from 20 Fura-2 loaded WT and 19 TPC1/2-double-KO MEF cells (gray lines correspond to each individual cell; mean Fura-2 ratio is shown as blue line). Cells were incubated first in Hank's balanced salt solution (HBSS) buffer supplemented with 2 mM CaCl2. Fura-2 ratios were analyzed after buffer exchange to Ca2+ free HBSS and addition of EGTA. Following incubation with TPC2-A1-N, 2.5 μM ionomycin was added. B, comparison of Fura-2 ratios at baseline levels and maximal Fura-2 ratios following treatment with TPC2-A1-N. C, comparison of Fura-2 ratios at baseline levels and maximal Fura-2 ratios after application of ionomycin. D, maximal Ca2+ release of MEF WT and TPC1/2-KO after treatment with TPC2-A1-N in HBSS buffer containing 2 mM CaCl2. E, single track Na+ recordings from 18 CoroNa-Green loaded TPC1/2-KO MEF cells (gray lines correspond to each individual cell; mean CoroNa-Green fluorescence intensity is shown as green line). CoroNa-Green fluorescence was analyzed in HBSS supplemented with 2 mM Ca2+. F, maximal changes of CoroNa-Green fluorescence after incubation with TPC2-A1-N. B-D, mean values represent the average maximal Fura-2 ratios of N experiments per cell line. B and C, Ca2+-free and EGTA protocol: MEF-WT (N = 12) MEF-TPC1/2KO (N = 18). D, 2 mM CaCl2 extracellular protocol: MEF-WT (N = 10) MEF-TPC1/2KO (N = 10); data are presented as mean ± SD. Two-way repeated measures ANOVA followed by Bonferroni’s multiple comparisons test. F, mean values represent the average maximal CoroNa-Green fluorescence of N experiments per cell line and treatment. MEF WT (dimethylsulfoxide-control N = 6) MEF-WT (N = 5) MEF-TPC1-KO (N = 6) MEF-TPC2 (N = 6) MEF-TPC1/2KO (N = 6); data are presented as mean ± SD. One-way ANOVA and Tukey’s multiple comparisons test; ∗∗p < 0.01, ∗∗∗p < 0.001, and ∗∗∗∗p < 0.0001. TPC, two-pore channel.
Figure 3
Figure 3
TPC2-A1-N induced Ca2+ release from intracellular stores in WT and TPC1/2 double KO J774 and HeLa cells.A, single track recordings from 21 Fura-2 loaded WT and 24 TPC1/2-KO J774 cells (gray lines correspond to each individual cell; mean Fura-2 ratio is shown as blue line). Fura-2 ratios were gathered in Ca2+-free Hank's balanced salt solution buffer. Following incubation with TPC2-A1-N, ionomycin was added. B, comparison of Fura-2 ratios at baseline levels and maximal Fura-2 ratios following treatment with TPC2-A1-N. C, comparison of Fura-2 ratios at baseline levels and maximal Fura-2 ratios after application of ionomycin. D, single track recordings from 22 Fura-2 loaded WT and 24 TPC1/2-KO HeLa cells (gray lines correspond to each individual cell; mean Fura-2 ratio is shown as blue line). Fura-2 ratios were gathered in Ca2+-free Hank's balanced salt solution buffer. Following incubation with TPC2-A1-N, 2.5 μM ionomycin was added. E, comparison of Fura-2 ratios at baseline levels and maximal Fura-2 ratios following treatment with TPC2-A1-N. F, comparison of Fura-2 ratios at baseline levels and maximal Fura-2 ratios after application of ionomycin. Mean of the average maximal Fura-2 ratios of N experiments per cell line; J774-WT (N = 4) J774-TPC1/2KO (N = 3); HeLa-WT (N = 15); HeLa-TPC1/2-KO (N = 12); data are presented as mean ± SD. Two-way repeated measures ANOVA followed by uncorrected Fisher’s least significant difference (B and C) or Bonferroni’s multiple comparisons (E and F) test; ∗p < 0.05, ∗∗p < 0.01, and ∗∗∗∗p < 0.0001. TPC, two-pore channel.
Figure 4
Figure 4
Residual TPC2-A1-N and thapsigargin evoked Ca2+ signals in MEF cells following application of thapsigargin or TPC2-A1-N.A, single track recordings from 22 Fura-2 loaded MEF-TPC1/2-KO cells (gray lines correspond to each individual cell; mean Fura-2 ratio is shown as blue line). Cells were incubated first in Hank's balanced salt solution (HBSS) supplemented with 2 mM CaCl2. Fura-2 ratios were analyzed following buffer exchange to Ca2+-free HBSS. EGTA (0.5 mM) and a washing step with Ca2+-free HBSS buffer were applied between each stimulation step. Following incubation with thapsigargin and TPC2-A1-N, 2.5 μM ionomycin was added. B, comparison of Fura-2 ratios at baseline levels and maximal Fura-2 ratios following treatment with 2.5 μM thapsigargin. C, comparison of Fura-2 ratios at baseline levels and maximal Fura-2 ratios following treatment with TPC2-A1-N. D, comparison of Fura-2 ratios at baseline levels and maximal Fura-2 ratios after application of ionomycin. E, single track recordings from 38 Fura-2 loaded MEF-TPC1/2-KO cells (gray lines correspond to each individual cell; mean Fura-2 ratio is shown as blue line). Cells were incubated first in HBSS supplemented with 2 mM CaCl2. Fura-2 ratios were analyzed following buffer exchange to Ca2+-free HBSS. EGTA (0.5 mM) and a washing step with Ca2+-free HBSS buffer were applied between each stimulation step. Following incubation with TPC2-A1-N and thapsigargin, 2.5 μM ionomycin was added. F, comparison of Fura-2 ratios at baseline levels and maximal Fura-2 ratios following treatment with 25 μM TPC2-A1-N. G, comparison of Fura-2 ratios at baseline levels and maximal Fura-2 ratios following treatment with 2.5 μM thapsigargin. H, comparison of Fura-2 ratios at baseline levels and maximal Fura-2 ratios after application of ionomycin. B-D, MEF-WT (N = 6) MEF-TPC1/2KO (N = 7). F-H, MEF-WT (N = 6) MEF-TPC1/2KO (N = 7); N = number of experiments. Data are presented as mean ± SD. Two-way repeated measures ANOVA followed by Bonferroni’s multiple comparisons test; ∗∗∗p < 0.001, ∗∗∗∗p < 0.0001. buffer exchange.
Figure 5
Figure 5
Decrease of luminal ER Ca2+-concentration in MEF cells after addition of thapsigargin or TPC2-A1-N.A and B, single track recordings of (A) 16 and (B) 12 TPC1/2-KO MEF cells transfected with ER-GCaMP6-210 (gray lines correspond to each individual cell; mean ER-GCaMP6-210 fluorescence intensity is shown as green line). Cells were treated with (A) 2.5 μM thapsigargin or (B) 25 μM TPC2-A1-N. ER-GCaMP6-210 fluorescence was analyzed in Hank's balanced salt solution supplemented with 2 mM Ca2+. C and D, changes in fluorescence at baseline and minimal ΔF/F0 values following treatment with (C) 2.5 μM thapsigargin (MEF WT N = 40 cells, MEF TPC1/2-KO N = 41 cells) or (D) 25 μM TPC2-A1-N (MEF WT N = 36 cells, MEF TPC1/2-KO N = 38 cells). Data are presented as mean ± SD. Two-way repeated measures ANOVA followed by Bonferroni’s multiple comparisons test (C and D); ∗∗∗∗p < 0.0001. E, example images from airyscan time-lapse videos of WT and TPC1/2-KO MEF cells transiently transfected with ER-GCaMP-210 (white) and treated with TPC2-A1-N and ionomycin. Image series shows initially untreated cells (0–2 min), addition of 20 μM TPC2-A1-N until ER-GCaMP-210-fluorescence was almost undetectable (5:00–9:30 min) and addition of 2.5 μM ionomycin (10:00 min-end). The scale bar represents 5 μm; time: mm:ss. ER, endoplasmic reticulum; TPC, two-pore channel.

References

    1. Calcraft P.J., Ruas M., Pan Z., Cheng X., Arredouani A., Hao X., et al. Naadp mobilizes calcium from acidic organelles through two-pore channels. Nature. 2009;459:596–600. - PMC - PubMed
    1. Brailoiu E., Churamani D., Cai X., Schrlau M.G., Brailoiu G.C., Gao X., et al. Essential requirement for two-pore channel 1 in naadp-mediated calcium signaling. J. Cell Biol. 2009;186:201–209. - PMC - PubMed
    1. Zong X., Schieder M., Cuny H., Fenske S., Gruner C., Rotzer K., et al. The two-pore channel tpcn2 mediates naadp-dependent ca2+-release from lysosomal stores. Pflugers Arch. 2009;458:891–899. - PMC - PubMed
    1. Rahman T., Cai X., Brailoiu G.C., Abood M.E., Brailoiu E., Patel S. Two-pore channels provide insight into the evolution of voltage-gated ca2+ and na+ channels. Sci. Signal. 2014;7 - PMC - PubMed
    1. Patel S. Function and dysfunction of two-pore channels. Sci. Signal. 2015;8 - PubMed

MeSH terms

LinkOut - more resources