Comparative Study
. 2025 Aug 10;24(1):326.
doi: 10.1186/s12933-025-02867-6.

Development and validation of a machine learning model for predicting vulnerable carotid plaques using routine blood biomarkers and derived indicators: insights into sex-related risk patterns

Affiliations
Comparative Study

Development and validation of a machine learning model for predicting vulnerable carotid plaques using routine blood biomarkers and derived indicators: insights into sex-related risk patterns

Yimin E et al. Cardiovasc Diabetol. .

Abstract

Background: Early detection of vulnerable carotid plaques is critical for stroke prevention. This study aimed to develop a machine learning model based on routine blood tests and derived indices to predict plaque vulnerability and assess sex-specific risk patterns across biomarker value ranges.

Methods: We retrospectively included 1701 hospitalized patients from Suzhou Municipal Hospital (2019-2020), selected from an initial cohort of 10,028 individuals. All patients underwent carotid ultrasound, with vulnerable plaques identified using predefined imaging criteria. A total of 30 laboratory variables-including blood count, coagulation, and biochemistry-were extracted, alongside derived indices such as triglyceride-glucose index (TyG), atherogenic index of plasma (AIP), neutrophil-to-lymphocyte ratio (NLR) and others. Features were standardized and selected based on statistical and clinical relevance. Five machine learning models were trained using a 7:3 train-test split and evaluated by cross-validation. Model performance was assessed using AUC, sensitivity, and specificity. The best model was interpreted using SHapley Additive exPlanations (SHAP) analysis. Sex differences were explored using Mann-Whitney U tests and restricted cubic spline (RCS) modeling across value intervals.

Results: The Random Forest model showed the highest predictive performance (AUC = 0.847; 95% CI 0.791-0.895; specificity = 89.4%; sensitivity = 64.2%). SHAP analysis identified gender, age, fibrinogen, NLR, creatinine, fasting blood glucose, uric acid to high-density lipoprotein ratio (UHR), TyG, systemic inflammation response index (SIRI), and lymphocyte count as top predictors. Significant sex-specific differences in SHAP values were observed for key biomarkers, including age, UHR, TyG, SIRI, and others. RCS modeling further revealed distinct sex-related patterns in plaque vulnerability across biomarker value ranges.

Conclusion: A Random Forest model integrating routine blood markers and derived indices accurately predicted vulnerable carotid plaques. The results underscore the importance of sex-specific risk assessment, highlighting differential effects of key biomarkers across genders and value intervals.

Keywords: Blood biomarkers; Machine learning; SHAP analysis; Sex differences; Vulnerable carotid plaque.


Conflict of interest statement

Supplementary information. Ethics approval and consent to participate: This study was a retrospective analysis approved by the Ethics Committee of Suzhou Municipal Hospital. Given the use of de-identified clinical data, the requirement for informed consent from individual participants was waived by the Ethics Committee. Competing interests: The authors declare no competing interests.

Figures
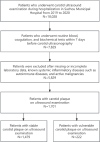
Fig. 1
Fig. 1
Flowchart of patient inclusion. Flow diagram illustrating the selection process of hospitalized patients undergoing carotid ultrasound at Suzhou Municipal Hospital from 2019 to 2020. After applying exclusion criteria, 1701 patients with carotid plaque were included in the final analysis, comprising 1479 with stable plaque and 222 with vulnerable plaque based on predefined criteria
Fig. 2
Fig. 2
Spearman correlation heatmaps across plaque subgroups. Spearman correlation matrices were generated using the final 26 selected features across: A the entire study population (n = 1701); B patients with stable carotid plaques (n = 1479); C patients with vulnerable carotid plaques (n = 222). The strength and direction of pairwise correlations are reflected by the custom “navy-pink” colormap, with navy indicating negative correlations and pink indicating positive correlations. Vulnerable plaque cases exhibited stronger and more clustered inter-variable relationships, particularly among inflammatory and metabolic markers. Fasting blood glucose (FBG), glycosylated hemoglobin A1c (HbA1c), creatinine (Cr), alanine aminotransferase (ALT), aspartate aminotransferase (AST), uric acid (UA), uric acid to HDL ratio (UHR ), triglyceride-glucose index (TyG), atherogenic index of plasma (AIP), total cholesterol (TC), low-density lipoprotein (LDL), fibrinogen (Fb), eosinophil count (EO), basophil count (BA), lymphocyte count (LYM), red blood cell count (RB), neutrophil count (NE), monocyte count (MO), systemic immune-inflammation index (SII), neutrophil-to-lymphocyte ratio (NLR), systemic inflammation response index (SIRI), aggregate index of systemic inflammation (AISI), platelet-to-lymphocyte ratio (PLR)
Fig. 3
Fig. 3
Receiver operating characteristic (ROC) curves of five machine learning models in the training and test sets. A ROC curves in the training set; B ROC curves in the test set. Random Forest, Logistic Regression, Support Vector Machine (SVM), K-Nearest Neighbors (KNN), and AdaBoost classifiers were evaluated. Shaded areas indicate 95% confidence intervals of the AUC estimated using 1000 bootstrap iterations
Fig. 4
Fig. 4
Global feature importance based on SHAP values in the Random Forest model. Bar plot showing the top 20 most important features ranked by mean absolute SHAP values derived from the Random Forest model. Fasting blood glucose (FBG), glycosylated hemoglobin A1c (HbA1c), creatinine (Cr), uric acid (UA), uric acid to HDL ratio (UHR ), triglyceride-glucose index (TyG), atherogenic index of plasma (AIP), total cholesterol (TC), low-density lipoprotein (LDL), fibrinogen (Fb), lymphocyte count (LYM), red blood cell count (RB), monocyte count (MO), systemic immune-inflammation index (SII), systemic inflammation response index (SIRI), platelet-to-lymphocyte ratio (PLR), neutrophil-to-lymphocyte ratio (NLR)
Fig. 5
Fig. 5
SHAP-based model interpretation visualizations for the Random Forest classifier. A SHAP summary plot showing the distribution of SHAP values for the top 20 features ranked by mean absolute importance. Each dot represents an individual observation in the test set, with color indicating the original feature value (red = high, blue = low). The x-axis reflects the SHAP value, representing the feature’s impact on model output. B SHAP decision plot illustrating the cumulative contribution of features to the model’s predicted probability for each patient. Lines represent individual patients, with colors denoting the model output (left = low risk, right = high risk). The visualization highlights how different combinations of feature values lead to diverse predictions across individuals. Fasting blood glucose (FBG), glycosylated hemoglobin A1c (HbA1c), creatinine (Cr), uric acid (UA), uric acid to HDL ratio (UHR ), triglyceride-glucose index (TyG), atherogenic index of plasma (AIP), total cholesterol (TC), low-density lipoprotein (LDL), fibrinogen (Fb), lymphocyte count (LYM), red blood cell count (RB), monocyte count (MO), systemic immune-inflammation index (SII), systemic inflammation response index (SIRI), platelet-to-lymphocyte ratio (PLR), neutrophil-to-lymphocyte ratio (NLR)
Fig. 6
Fig. 6
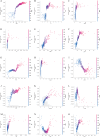
AO SHAP dependence plots of top-ranked continuous features in the overall cohort. Each panel depicts the relationship between raw feature values (x-axis) and their corresponding SHAP values (y-axis), reflecting the marginal contribution of each variable to the predicted probability of vulnerable carotid plaque. Color gradients indicate the relative magnitude of feature values across observations. Fasting blood glucose (FBG), glycosylated hemoglobin A1c (HbA1c), creatinine (Cr), uric acid to HDL ratio (UHR ), triglyceride-glucose index (TyG), atherogenic index of plasma (AIP), low-density lipoprotein (LDL), fibrinogen (Fb), lymphocyte count (LYM), systemic immune-inflammation index (SII), systemic inflammation response index (SIRI), platelet-to-lymphocyte ratio (PLR), neutrophil-to-lymphocyte ratio (NLR)
Fig. 7
Fig. 7
Sex-specific correlation heatmaps of top predictive features. A Spearman correlation heatmap of in female participants. B Spearman correlation heatmap in male participants. Fasting blood glucose (FBG), glycosylated hemoglobin A1c (HbA1c), creatinine (Cr), uric acid (UA), uric acid to HDL ratio (UHR ), triglyceride-glucose index (TyG), atherogenic index of plasma (AIP), total cholesterol (TC), low-density lipoprotein (LDL), fibrinogen (Fb), lymphocyte count (LYM), red blood cell count (RB), monocyte count (MO), systemic immune-inflammation index (SII), systemic inflammation response index (SIRI), platelet-to-lymphocyte ratio (PLR), neutrophil-to-lymphocyte ratio (NLR)
Fig. 8
Fig. 8
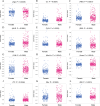
AL Sex-specific SHAP value distributions of key predictors. Scatter plots compare SHAP values between female and male participants. Only features with statistically significant sex-based differences (P < 0.05, Mann–Whitney U test) were included. Fasting blood glucose (FBG), glycosylated hemoglobin A1c (HbA1c), creatinine (Cr), uric acid (UA), uric acid to HDL ratio (UHR ), triglyceride-glucose index (TyG), atherogenic index of plasma (AIP), total cholesterol (TC), low-density lipoprotein (LDL), fibrinogen (Fb), lymphocyte count (LYM), red blood cell count (RB), monocyte count (MO), systemic immune-inflammation index (SII), systemic inflammation response index (SIRI), platelet-to-lymphocyte ratio (PLR), neutrophil-to-lymphocyte ratio (NLR)
Fig. 9
Fig. 9
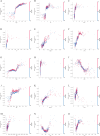
AO SHAP dependence plots of the top 15 features, stratified by gender. Each subplot illustrates the relationship between the raw feature value (x-axis) and the corresponding SHAP value (y-axis), reflecting the marginal contribution of the feature to the model’s predicted probability of vulnerable carotid plaque. Data points are color-coded by gender (red = male, blue = female), allowing visualization of sex-specific effect patterns. Fasting blood glucose (FBG), glycosylated hemoglobin A1c (HbA1c), creatinine (Cr), uric acid to HDL ratio (UHR ), triglyceride-glucose index (TyG), atherogenic index of plasma (AIP), low-density lipoprotein (LDL), fibrinogen (Fb), lymphocyte count (LYM), systemic immune-inflammation index (SII), systemic inflammation response index (SIRI), platelet-to-lymphocyte ratio (PLR), neutrophil-to-lymphocyte ratio (NLR)
Fig. 10
Fig. 10
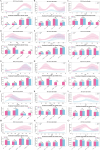
AO Sex-stratified RCS modeling of predicted probabilities across biomarker value intervals. RCS curves (upper panels) visualize the predicted probability of vulnerable plaque stratified by gender, with shaded areas representing 95% confidence intervals. Bar plots (lower panels) compare average predicted probabilities between male and female patients across binned biomarker intervals. Only biomarkers or features with at least one significant gender-based difference are included. P-values are derived from independent two-sample t-tests; asterisks denote significance levels (*P < 0.05, **P < 0.01, ***P < 0.001, ns = not significant). Fasting blood glucose (FBG), creatinine (Cr), uric acid (UA), uric acid to HDL ratio (UHR ), triglyceride-glucose index (TyG), atherogenic index of plasma (AIP), total cholesterol (TC), low-density lipoprotein (LDL), fibrinogen (Fb), red blood cell count (RB), monocyte count (MO), systemic inflammation response index (SIRI), neutrophil-to-lymphocyte ratio (NLR)

Similar articles

References

    1. Saba L, Cau R, Murgia A, Nicolaides AN, Wintermark M, Castillo M, Staub D, Kakkos SK, Yang Q, Paraskevas KI, et al. Carotid Plaque-RADS: a novel stroke risk classification system. JACC Cardiovasc Imaging. 2024;17(1):62–75. - PubMed
    1. Kopczak A, Schindler A, Bayer-Karpinska A, Koch ML, Sepp D, Zeller J, Strecker C, Hempel JM, Yuan C, Malik R, et al. Complicated carotid artery plaques as a cause of cryptogenic stroke. J Am Coll Cardiol. 2020;76(19):2212–22. - PubMed
    1. Saba L, Saam T, Jäger HR, Yuan C, Hatsukami TS, Saloner D, Wasserman BA, Bonati LH, Wintermark M. Imaging biomarkers of vulnerable carotid plaques for stroke risk prediction and their potential clinical implications. Lancet Neurol. 2019;18(6):559–72. - PubMed
    1. Johri AM, Herr JE, Li TY, Yau O, Nambi V. Novel ultrasound methods to investigate carotid artery plaque vulnerability. J Am Soc Echocardiogr Off Publ Am Soc Echocardiogr. 2017;30(2):139–48. - PubMed
    1. Schindler A, Schinner R, Altaf N, Hosseini AA, Simpson RJ, Esposito-Bauer L, Singh N, Kwee RM, Kurosaki Y, Yamagata S, et al. Prediction of stroke risk by detection of hemorrhage in carotid plaques: meta-analysis of individual patient data. JACC Cardiovasc Imaging. 2020;13(2 Pt 1):395–406. - PubMed

LinkOut - more resources