. 2025 Aug 10;15(1):29265.
doi: 10.1038/s41598-025-14516-9.

Afatinib amplifies cAMP-induced fluid secretion in a mouse mini-gut model via TMEM16A-mediated fluid secretion and secretory cell differentiation

Affiliations

Afatinib amplifies cAMP-induced fluid secretion in a mouse mini-gut model via TMEM16A-mediated fluid secretion and secretory cell differentiation

Jutharat Ariyadamrongkwan et al. Sci Rep. .

Abstract

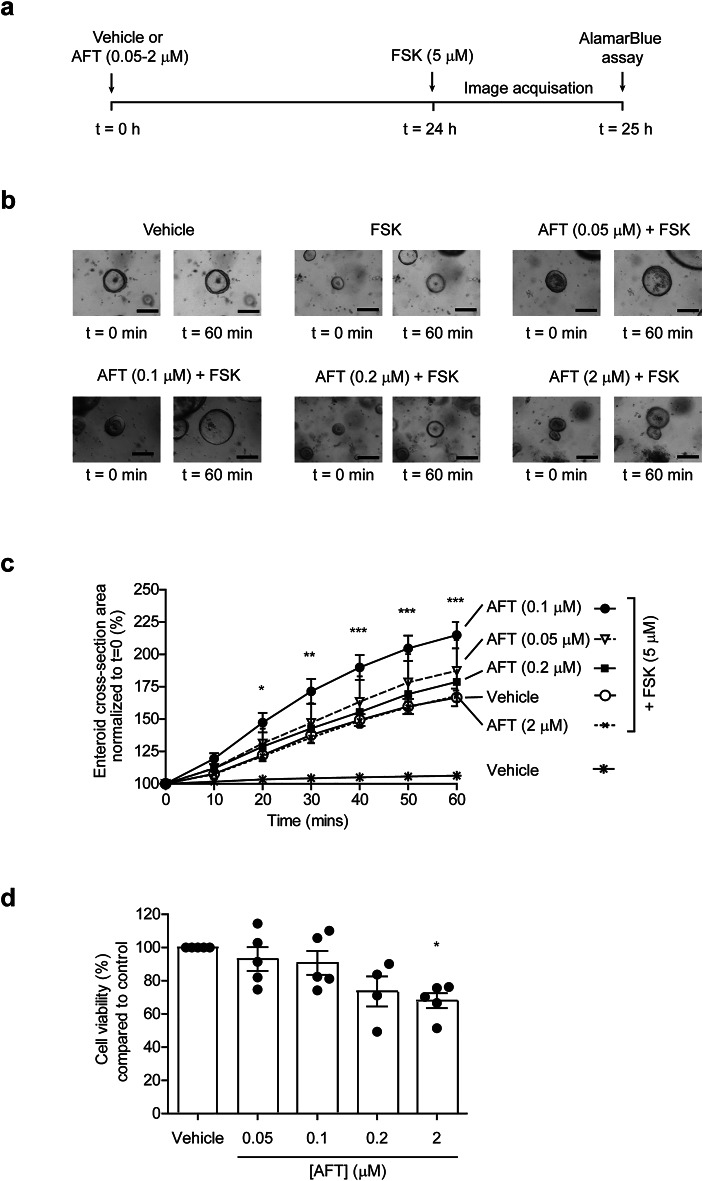
Afatinib is an effective treatment of metastatic non-small cell lung cancer, despite the occurrence of its common gastrointestinal toxicities especially diarrheas, which lead to dose adjustments or treatment cessation in severe cases. Underlying mechanisms of afatinib-induced diarrheas under prolonged treatment remain elusive. This study aimed to investigate mechanisms involved in the afatinib-induced fluid secretion in three-dimensional (3D) mouse mini-gut models under prolonged treatment (24 h). The swelling assay, qRT-PCR, and immunoblotting experiments were performed. Our results showed that afatinib amplified the cAMP-induced fluid secretion by 2 folds by mechanisms requiring TMEM16A and Kv7 channels via EPAC-calcium-dependent pathways. Additionally, afatinib treatment increased Kv7.1 and NKCC1 expression. Interestingly, afatinib induced secretory cell differentiation and upregulation of Paneth cell markers. Treatment with a PI3K inhibitor mimicked the effect of afatinib on increasing expression of membrane transporters and secretory lineage cell markers with no additive effect being observed after combination with afatinib, suggesting that the observed effect of afatinib was via PI3K inhibition. Collectively, our results indicate that prolonged afatinib treatment enhances cAMP-induced fluid secretion by mechanisms involving EPAC-TMEM16A-Kv7.1-mediated fluid secretion and secretory cell differentiation in 3D mouse mini-gut models. The EPAC-TMEM16A-Kv7.1-mediated fluid secretion represents a promising therapeutic target for treating afatinib-induced diarrheas.

Keywords: Afatinib; Diarrhea; Fluid secretion; Kv7.1; Paneth cell; TMEM16A.


Conflict of interest statement

Competing interests: The authors declare no competing interests.

Figures

Fig. 1
Fig. 1
Effect of afatinib on basal fluid transport in 3D mouse colonoids (a) Representative images of mouse colonoids after treatment with vehicle or afatinib (AFT) (0.05-2 µM) at time points of 0, 60, 180, and 360 min in swelling assays. Scale bar = 100 μm. (b) A graph illustrating the colonoid cross-sectional areas taken every 10 min, normalized to the area at time point of 0 min. Graph was plotted against the time elapsed during the swelling assay. Results are means ± S.E.M (n = 3 technical replicates). NS, Not significant compared with the vehicle by 2-way ANOVA followed by Bonferroni posttests.
Fig. 2
Fig. 2
Effect of prolonged treatment with afatinib on forskolin (FSK)-induced fluid secretion in 3D mouse colonoids. (a) Colonoids were pretreated with AFT (0.05-2 µM) or vehicle for 24 h. After adding forskolin (FSK) (5 µM), a cAMP-dependent chloride secretagogue, the swelling assay was performed with image acquisition being performed every 10 min for 1 h. In addition, AlarmaBlue assay was performed to test the effect of AFT on cell viability. (b) Representative images of mouse colonoids at indicated time points of the swelling assay. Scale bar = 100 μm. (c) A graph illustrating the colonoid cross-sectional area taken every 10 min, normalized to the area at 0 min, plotted against the time elapsed during the swelling assay. Results are means ± S.E.M. (n = 3–5 technical replicates). *, P < 0.05; **, P < 0.01; ***, P < 0.001 compared with the FSK group by 2-way ANOVA followed by Bonferroni posttests. (d) A graph showing the percentage of cell viability normalized by vehicle from AlamarBlue assay. Results are means ± S.E.M. (n = 4–5 technical replicates). *, P < 0.05 compared with the vehicle by ANOVA followed by Turkey’s post hoc test.
Fig. 3
Fig. 3
Role of apical chloride channels (a) Colonoids were pretreated with AFT (0.1 µM) or vehicle for indicated durations followed by co-incubation with vehicle, (b) CaCCinh-A01 (30 µM), (c) CFTRinh−172 (20 µM), or (d) Ani9 (1 µM). After adding FSK (5 µM), the swelling assay was performed with image acquisition being done every 10 min for 1 h. Representative images of colonoids indicated time points of the swelling assay were shown. Scale bar = 100 µm. A graph illustrating the colonoid cross-sectional areas taken every 10 min, normalized to the area at time point of 0 min, was plotted against the time elapsed during the swelling assay. Results are means ± S.E.M. (n = 3–5 technical replicates). *, P < 0.05; **, P < 0.01; ***, P < 0.001 compared with FSK group. #, P < 0.05; ##, P < 0.01; compared with AFT plus FSK. $$, P < 0.01; $$$, P < 0.001 compared with AFT plus CFTRinh−172 plus FSK. All results were analyzed by 2-way ANOVA followed by Bonferroni posttests.
Fig. 4
Fig. 4
Roles of basolateral potassium channels. Colonoids were pretreated with AFT (0.1 µM) or vehicle at indicated durations before co-incubation with vehicle, (a) Tram34 (2 µM), a KCa3.1 inhibitor, or (b) XE991 (30 µM), a Kv7.1 inhibitor. After adding FSK (5 µM), the swelling assay was performed with image acquisition every 10 min for 1 h. Representative images of mouse colonoids at indicated time points of the swelling assay were shown. Scale bar = 100 μm. A graph illustrating the colonoid cross-sectional areas taken every 10 min, normalized to the area at 0 min, was plotted against the time elapsed during the swelling assay. Results are means ± S.E.M. (n = 3–4 technical replicates). *, P < 0.05; **, P < 0.01; ***, P < 0.001 compared with FSK group. ###, P < 0.001 compared with AFT plus FSK. All results were analyzed by 2-way ANOVA followed by Bonferroni posttests.
Fig. 5
Fig. 5
Involvement of calcium and EPAC in the amplifying effect of afatinib. (a) Colonoids were pretreated with AFT (0.1 µM) or vehicle before exposure to vehicle, (b) BAPTA-AM (20 µM), a calcium chelator or (c) ESI-09 (10 µM), EPAC inhibitor. After adding FSK (5 µM), the swelling assay was performed with image acquisition was taken every 10 min for 1 h. Representative images of mouse colonoids at indicated time points of the swelling assay were shown. Scale bar = 100 μm. A graph illustrating the colonoid cross-sectional areas taken every 10 min, normalized to the area at 0 min, was plotted against the time elapsed during the swelling assay. Results are means ± S.E.M. (n = 3 technical replicates). *, P < 0.05; **, P < 0.01 compared with vehicle. ##, P < 0.01; ###, P < 0.001 compared with AFT plus FSK. All results were analyzed by 2-way ANOVA followed by Bonferroni posttests.
Fig. 6
Fig. 6
Effect of prolonged treatment with afatinib on expression of membrane transport proteins involved in chloride secretion. (a) Effect on mRNA expression. qRT-PCR was performed to measure mRNA expression of TMEM16A, CFTR, potassium calcium-activated channel subfamily N member 4 (KCa3.1), potassium voltage-gated channel subfamily Q member 1 (Kv7.1), and sodium potassium chloride cotransporter 1 (NKCC1), normalized by vehicle, after treatment of AFT (0.1 µM) or vehicle for 24 h (n = 3–4). Western blot analyses were performed to investigate the protein expression of NKCC1 (b), Kv7.1(c), and TMEM16A (d) after treatment with AFT or vehicle for 24 h. The blots were cropped for clarity, and the original images are provided in Supplementary Figure S3. Results are means ± S.E.M. (n = 3 technical replicates). *, P < 0.05; **, P < 0.01 compared with vehicle. All results were analyzed by Student t-test.
Fig. 7
Fig. 7
Effect of prolonged treatment with afatinib on intestinal epithelial cell differentiation. The qRT-PCR was performed to measure mRNA expression of MKI-67, G-protein-coupled receptor 5 (LGR5), Hes family bHLH transcription factor 1 (HES1), atonal bHLH transcription factor 1 (ATOH1), neurogenin-3 (NEUROG3), MUC2, and lysozyme 1 (LYZ1) after treatment with AFT (0.1µM) or vehicle for 24 h. Results are means ± S.E.M. (n = 4 technical replicates). *, P < 0.05 compared with vehicle. All results were analyzed by Student t-test.
Fig. 8
Fig. 8
Role of PI3K in afatinib-induced alteration of transport protein expression and secretory lineage differentiation. (a) Confirmation of PI3K inhibition by afatinib. Western blot analysis was performed to measure the protein expression of P-PI3K in colonoids treated with AFT (0.1 µM) or vehicle for 24 h. The blots were cropped for clarity, and the original images are provided in Supplementary Figure S4. Results are means ± S.E.M. (n = 3). *, P < 0.05; **, P < 0.01 compared with vehicle. The results were analyzed by Student t-test. (b) Role of PI3K in mediating the effect of afatinib on mRNA expression. Colonoids were treated with vehicle, AFT, BAY-80-6946 (50 nM; a PI3K inhibitor) or AFT plus BAY-80-6946 for 24 h before mRNA extraction and qRT-PCR being performed to analyze mRNA expression of NKCC1, Kv7.1, TMEM16A, ATOH1, and LYZ1. Results are means ± S.E.M. (n = 3–7 technical replicates). *, P < 0.05; **, P < 0.01 compared with vehicle. The results were analyzed by ANOVA followed by Turkey’s post hoc test.

Similar articles

References

    1. Rugo, H. S. et al. The characterization, management, and future considerations for ErbB-family TKI-associated diarrhea. Breast Cancer Res. Treat.175 (1), 5–15 (2019). - PMC - PubMed
    1. Tao, G. & Chityala, P. K. Epidermal growth factor receptor inhibitor-induced diarrhea: clinical incidence, toxicological mechanism, and management. Toxicol Res (Camb). 10 (3), 476–486 (2021). - PMC - PubMed
    1. Sartori, G. et al. Efficacy and safety of Afatinib for non-small-cell lung cancer: state-of-the-art and future perspectives. Expert Rev. Anticancer Ther.20 (7), 531–542 (2020). - PubMed
    1. Van Sebille, Y. Z., Gibson, R. J., Wardill, H. R. & Bowen, J. M. ErbB small molecule tyrosine kinase inhibitor (TKI) induced diarrhoea: chloride secretion as a mechanistic hypothesis. Cancer Treat. Rev.41 (7), 646–652 (2015). - PubMed
    1. Huang, J. et al. Safety profile of epidermal growth factor receptor tyrosine kinase inhibitors: A disproportionality analysis of FDA adverse event reporting system. Sci. Rep.10 (1), 4803 (2020). - PMC - PubMed

LinkOut - more resources