. 2025 Aug 20;147(33):29687-29701.
doi: 10.1021/jacs.5c03389. Epub 2025 Aug 10.

The Role of Ethanol in Lithium-Mediated Nitrogen Reduction

Affiliations

The Role of Ethanol in Lithium-Mediated Nitrogen Reduction

Olivia Westhead et al. J Am Chem Soc. .

Abstract

Although the Haber-Bosch process for industrial ammonia production is hailed by many as one of the most influential breakthroughs of the 20th century, its decarbonization and decentralization remain a critical challenge. One of the most promising and fast improving approaches is electrochemical nitrogen reduction mediated by lithium. However, the impact of electrolyte configuration on the formation of the solid electrolyte interphase (SEI) and its effect on selective nitrogen reduction is still elusive. In particular, the role of commonly added, supposedly sacrificial, proton donors on SEI chemistry and morphology remains a mystery. In this work, the impact of ethanol concentration in a 1 M LiNTf2 in THF electrolyte on SEI properties and nitrogen reduction is analyzed via a multipronged characterization approach. Post-mortem surface analysis via X-ray photoelectron spectroscopy shows a dependence in the relative proportion of LiF and Li2O on ethanol concentration, while depth profiling measurements via cluster source time-of-flight secondary ion mass spectrometry reveal increasing SEI electrolyte permeability at higher ethanol concentrations. Cryogenic electron microscopy measurements show a reduction in SEI thickness with increased ethanol concentration, as well as increased SEI homogeneity. Lithium metal is also observed only in the ethanol-free condition. Analysis of bulk SEI components via titration corroborates the observation of lithium metal in cryo-microscopy measurements, as well as showing an increase in bulk Li2-xOHx content with ethanol concentration. A narrow 'Goldilocks' region is revealed, where the SEI has just the right properties for efficient nitrogen reduction.


Figures
1
1
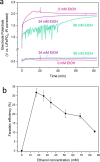
Variation in electrochemical performance of a 1 M LiNTf2 in THF electrolyte at 1 bar N2 with varying concentrations of ethanol. (a) Variation in working (Mo foil, WE) and counter (Pt mesh, CE) electrode potentials vs a LiFePO4 reference, under a constant applied current density of −2 mA cm–2 until −10 C is passed. All potentials are corrected for ohmic drop. Pink = 0 mM (0 vol %), purple = 34 mM (0.2 vol %), and green = 86 mM (0.5 vol %) ethanol. (b) Variation in Faradaic efficiency toward ammonia after passing −10 C at a constant applied current density of −2 mA cm–2 (n = 3). Electrochemistry and quantification methods are shown in Figures S1 and S2.
2
2
Scanning electron microscopy micrographs of solid electrolyte interphase (SEI) cross sections obtained by focused ion beam milling in the 0 mM ethanol condition (1 M LiNTf2, THF as majority solvent) after −10 C was passed at a constant current of −2 mA cm–2 on a Mo working electrode. <10 μL THF was drop-cast on the electrode inside an N2 glovebox prior to plunge freezing in liquid nitrogen inside the glovebox and then transfer under cryogenic conditions and vacuum to the microscope. Micrographs a-c were taken using the backscatter detector, while micrograph d was taken using the secondary electron detector. (a) Full SEI cross section, where the light contrast at the bottom of the micrograph is the Mo electrode. (b) Zoomed in micrograph of the areas of black contrast and voids in the full SEI cross section. (c) Zoomed in micrograph of a void surrounded by rings of different contrast. (d) Zoomed in micrograph of the area close to the electrode surface. The lighter contrast area with large grains at the bottom of the micrograph is the Mo electrode. (e) Simplified schematic of the 0 mM ethanol SEI, showing the porous inner SEI and the dense outer SEI containing dead Li (solid black) and voids (hatched areas) surrounded by rings of differing contrast.
3
3
Scanning electron microscopy micrographs of solid electrolyte interphase (SEI) cross sections obtained by focused ion beam milling in (a, b) 26 and (c, d) 86 mM ethanol electrolyte (1 M LiNTf2, THF as majority solvent) after −10 C was passed at a constant current of −2 mA cm–2 on a Mo working electrode. (a) Cross section of the porous SEI formed in 26 mM ethanol. The Mo is visible at the bottom of the micrograph with large grains. (b) More zoomed in image of the interface between the SEI and Mo electrode on the same cross section as (a). (c) Simplifies the schematic of the 26 mM EtOH SEI, showing uniform dense porosity throughout with no evidence for dead Li. (d) Cross section of the SEI formed in 86 mM ethanol. <10 μL of THF was dropcast onto the sample prior to immersion in liquid nitrogen inside an N2 glovebox and transfer to the microscope under vacuum and cryogenic conditions. The THF is visible as the light contrast at the top of the micrograph. The Mo electrode is visible as the lighter contrast at the bottom of the micrograph. (e) Higher magnification cross section of a different SEI sample formed in 86 mM ethanol. This sample was coated with 1 μm Au by sputter deposition without air exposure prior to cryo-microscopy (shown by the very light contrast at the top of the cross section). The Mo is visible at the bottom of the cross section. Micrographs were all taken using the secondary electron detector, except for (d), which was taken with the backscattered electron detector. (f) Simplified schematic of the 86 mM EtOH SEI, showing uniform dense porosity throughout with no evidence for dead Li. The SEI is much thinner than the 26 mM EtOH case. Parallel cracks in (a, b) may be artifacts resulting from the sample preparation or cooling process.
4
4
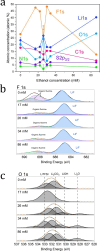
X-ray photoelectron spectroscopy results of the solid electrolyte interphase (SEI) formed on a Mo working electrode after passing −10 C at −2 mA cm–2 under 1 bar N2 in a 1 M LiNTf2 in THF electrolyte with varying ethanol content. All core level spectra are normalized to the maximum for that spectrum. Fitting parameters and survey spectra (Figure S7) are presented in the Supporting Information. Samples were transferred to the spectrometer without air exposure. (a) Variation in the atomic concentration of F, Li, O, C, S, and N from 0 to 86 mM ethanol. The error bars on the 0 mM data points represent the standard deviation in the measurement of two spots on the same sample, while the error bar on the 26 mM data point represents the standard deviation of the measurement of two separate samples. (b, c) F 1s and O 1s core level spectra, respectively. The Li 1s and N 1s core level spectra had no clear features but were fitted to provide the relative atomic concentration (Figure S8).
5
5
Bulk composition of the SEI following its reactive dissolution post measurement and titration of produced analytes (so-called SEI titration). Taken after −10 C of charge was passed at −2 mA cm–2 on a Mo working electrode in a 1 M LiNTf2 in THF electrolyte containing different ethanol concentrations. Relative molar concentrations are shown as a percentage of the total quantity of Li0, Li2O/LiOH, LiH, LiF, and Li x N y H z measured. Measurement and calculation details can be found in the Supporting Information. Error bars show the standard error in the mean from two separate electrochemical measurements.
6
6
Time of flight secondary ion mass spectrometry traces showing the variation in relative intensity for various fragments of interest through the depth of a solid electrolyte interphase sample. The SEI samples were formed in a 1 M LiNTf2 in THF electrolyte containing different ethanol concentrations after the application of −2 mA cm–2 on a 1 cm2 Mo electrode until −10 C were passed under 1 bar N2. The different ethanol concentrations were 0 (pink, 0 vol %), 17 (yellow, 0.1 vol %), and 86 mM (0.5 vol %, green). For the 17 and 86 ethanol samples, the full depth was probed, and so relative depth is shown as a percentage distance through the SEI layer (0% being the surface, 100% being the SEI-electrode interface). For the 0 mM ethanol sample, the SEI layer was too thick to be probed all the way to the electrode interface. These traces are shown with respect to sputter time instead. The fragments of interest are (a) Li+, (b) C+, (c) F+, (d) O+, (e) S+, and (f) N+. Full experimental details and further traces can be found in the SI.

References

    1. Smith C., Hill A. K., Torrente-Murciano L.. Current and Future Role of Haber-Bosch Ammonia in a Carbon-Free Energy Landscape. Energy Environ. Sci. 2020;13(2):331–344. doi: 10.1039/C9EE02873K. - DOI
    1. MacFarlane D. R., Cherepanov P. V., Choi J., Suryanto B. H. R., Hodgetts R. Y., Bakker J. M., Ferrero Vallana F. M., Simonov A. N.. A Roadmap to the Ammonia Economy. Joule. 2020;4(6):1186–1205. doi: 10.1016/j.joule.2020.04.004. - DOI
    1. Chang W., Jain A., Rezaie F., Manthiram K.. Lithium-Mediated Nitrogen Reduction to Ammonia via the Catalytic Solid-Electrolyte Interphase. Nat. Catal. 2024;7(3):231–241. doi: 10.1038/s41929-024-01115-6. - DOI
    1. Smith C., Torrente-Murciano L.. The Potential of Green Ammonia for Agricultural and Economic Development in Sierra Leone. One Earth. 2021;4(1):104–113. doi: 10.1016/j.oneear.2020.12.015. - DOI
    1. Seh Z. W., Kibsgaard J., Dickens C. F., Chorkendorff I., No̷rskov J. K., Jaramillo T. F.. Combining Theory and Experiment in Electrocatalysis: Insights into Materials Design. Science (1979) 2017;355(6321):aad4998. doi: 10.1126/science.aad4998. - DOI - PubMed

LinkOut - more resources