. 2025 Aug 8:29:0232.
doi: 10.34133/bmr.0232. eCollection 2025.

Ultrasound-Targeted Nanobubbles Codelivering NKP-1339 and miR-142-5p for Synergistic Mitochondrial Immunogenic Cell Death and PD-L1 Inhibition in Cancer Therapy

Affiliations

Ultrasound-Targeted Nanobubbles Codelivering NKP-1339 and miR-142-5p for Synergistic Mitochondrial Immunogenic Cell Death and PD-L1 Inhibition in Cancer Therapy

Yafei Zhang et al. Biomater Res. .

Abstract

The combination of chemical immunotherapy and gene therapy holds great promise for malignant tumor treatment. Here, we developed an ultrasound-targeted liposome nanobubbles system (NKP-1339/miR-142-NBs) for precise codelivery of drugs and genes to treat esophageal squamous cell carcinoma (ESCC) with ultrasound-targeted microbubble destruction (UTMD). This study systematically investigated the system's therapeutic mechanisms-including mitochondrial dysfunction induction, immunogenic cell death (ICD), and antitumor immune activation-alongside its pharmacokinetics and targeting efficiency. In an ESCC mouse model, NKP-1339/miR-142-NBs combined with ultrasound markedly suppressed tumor growth (79.72% ± 0.1% vs. NB control 18.79% ± 1.29%) through NKP-1339 triggering ICD and miR-142-5p down-regulating programmed death-ligand 1 (PD-L1) expression, synergistically potentiating immune responses. Furthermore, we found that triggering ICD, including the exposure of calreticulin on the cell membrane, was related to altering mitochondrial fission dynamics in the ESCC cells. The down-regulation of PD-L1 expression by miR-142-5p reactivated CD8+ T cells by relieving programmed death-1 (PD-1)/PD-L1-mediated immunosuppression, enhancing immune memory and antitumor efficacy. Moreover, the UTMD technique enhanced the tumoral accumulation and penetration of nanobubbles, improving delivery specificity and minimizing off-target effects. This combined treatment strategy, including UTMD, provides a promising translational potential for ESCC therapy.


Conflict of interest statement

Competing interests: The authors declare that they have no competing interests.

Figures

Fig. 1.
Fig. 1.
Schematic representation of the design and mechanism of NKP-1339/miR-142-5p-NBs. The nanobubble system enables US-triggered codelivery of NKP-1339 and miR-142-5p to tumor cells. NKP-1339 induces ICD by disrupting mitochondrial function, elevating ROS, and triggering CRT externalization and HMGB1/ATP release. Concurrently, miR-142-5p down-regulates PD-L1 expression, reversing immune suppression. These combined effects facilitate CD8+ T cell activation and potentiate antitumor immune responses in esophageal squamous cell carcinoma. DRP1, dynamin-related protein 1; OPA1, optic atrophy 1; PGC1-α, peroxisome proliferator-activated receptor gamma coactivator 1-alpha; MHC I, major histocompatibility complex I; TCR, T cell receptor; CD80, cluster of differentiation 80; CD86, cluster of differentiation 86; CD28, cluster of differentiation 28; PD-1, programmed cell death protein 1; Cytotoxic CD8+, cytotoxic CD8+ T cells; IFN-γ, interferon gamma; TNF-α, tumor necrosis factor-alpha.
Fig. 2.
Fig. 2.
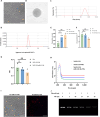
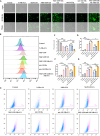
Preparation and characterization of NKP-1339/miR-142 NBs. (A) Morphology of NKP-1339/miR-142-NBs observed by optical microscopy (scale bar = 10 μm). (B) Morphological features of NBs were observed using transmission electron microscopy (80,000× magnification, scale bar = 200 nm). (C) Particle size distribution of NKP-1339/miR-142-NBs. (D) Zeta potential analysis of the surface charge of the NBs. (E) Particle size analysis of various modified nanobubble groups. (F) Zeta potential analysis of various modified nanobubble groups. (G) Polydispersity index (PDI) analysis of various modified nanobubble groups. (H) UV–Vis absorption spectra of NKP-1339/miR-142-NBs and free NKP-1339 showing no significant changes. (I) Red fluorescence of propidium iodide-stained miR-142 plasmid (PI-miR-142) on the surface of miR-142-NBs was observed using fluorescence microscopy (magnification 200×, scale bar = 10 μm). (J) Agarose gel electrophoresis confirming the loading capacity of the NBs for miR-142 plasmid.
Fig. 3.
Fig. 3.
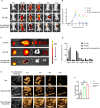
Pharmacokinetic analysis and tissue distribution of NKP-1339/miR-142-NBs+US. (A) Fluorescence distribution in tumor-bearing mice of different groups (Free-Dir, Dir-NBs, and Dir-NKP-1339/miR-142-NBs+US) was detected by the in vivo imaging system (IVIS). (B) Quantitative analysis of tissue fluorescence intensity from panel (A). (C) Fluorescence imaging of organs at 24 h postinjection for each group. (D) Quantitative analysis of tumor and organ fluorescence intensity from panel (C). (E) Contrast-enhanced US imaging results showing that NKP-1339/miR-142-NBs+US enhanced imaging and in vivo targeted detection. (F) Quantitative analysis of peak intensity in tumor regions for different groups. *P < 0.05, **P < 0.01.
Fig. 4.
Fig. 4.
In vivo experiment on the anticancer effect of NKP-1339/miR-142-NBs combined with US treatment in esophageal cancer subcutaneous xenografts of mice. (n = 6 per group). (A) Schematic diagram of the in vivo treatment protocol for esophageal cancer-bearing mice. (B) Comparison of tumor sizes in mice from each group. (C) Tumor growth curves for mice in each group. (D) Changes in body weight of mice in each group.
Fig. 5.
Fig. 5.
Mechanism on immune response of NK cell and macrophage induced by NKP-1339/miR-142-NBs combined with US treatment. (A and B) Flow cytometry analysis of the in vitro proliferation activity and proliferation index of splenic lymphocytes in each group. (C and D) Flow cytometry analysis of the proportion of CTL cells in each group and quantitative analysis. (E) Lactate dehydrogenase (LDH) release assay to evaluate the cytotoxic activity of CTL cells in vitro. (F to K) Immunofluorescence analysis of tumor tissue for the infiltration of CD3+ T CD8+ T cells and the expression of IFN-γ, along with semiquantitative analysis (200×, scale bar = 100 μm). (L and M) mRNA expression of TNF-α and IFN-γ in tumor tissues. *P < 0.05, **P < 0.01, ***P < 0.001.
Fig. 6.
Fig. 6.
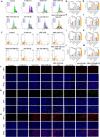
Mechanism on augmented ICD induced by NKP-1339/miR-142-NBs combined with US treatment. (A and C) Immunofluorescence analysis of CRT exposure on the surface of tumor cells in different treatment groups and semiquantitative analysis (200×, scale bar = 100 μm). (B and D) Flow cytometry analysis of CRT expression levels in each group and quantitative analysis. (E to I) Western blot analysis of CRT, HMGB1, HSP70, and HSP90 release levels and semiquantitative analysis. (J) qPCR analysis of mRNA expression levels of CRT, HMGB1, HSP70, and HSP90. *P < 0.05, **P < 0.01, ***P < 0.001.
Fig. 7.
Fig. 7.
NKP-1339/miR-142-NBs combined with US treatment synergistically disrupt mitochondrial function via concurrent ATP depletion, ROS burst, and calcium dysregulation. (A and D) Immunofluorescence staining to detect ROS levels within esophageal cancer cells and semiquantitative analysis (200×, scale bar = 100μm). (B and F) Flow cytometry-based quantification of ROS-positive cell percentage. (C) Mitochondrial ATP levels measurement. (E to G) Flow cytometry analysis of calcium ion concentration changes and quantitative analysis. *P < 0.05, **P < 0.01, ***P < 0.001.
Fig. 8.
Fig. 8.
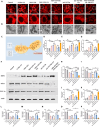
NKP-1339/miR-142-NBs combined with US treatment provoke pathological mitochondrial fission leading to structural disintegration in esophageal cancer cells. (A and D) Confocal fluorescence microscopy images of esophageal cancer cells showing mitochondrial fluorescence, with quantification of fragmented cells (scale bar = 50 μm). (C) Diagram of mitochondrial fission-regulating genes. (B and E) Representative TEM images (×20,000) of mitochondria in esophageal tumor tissues from different groups, and quantification of damaged mitochondria. Scale bar = 500 nm. (F to I) WB analysis of mitochondrial fission and fusion-related proteins, with semiquantitative analysis. (J to P) qPCR analysis of mRNA expression levels of mitochondrial function-related genes (DRP1, FIS1, OPA1, PGC1-α, NRF1, MFN2, and TFAM). *P < 0.05, **P < 0.01, ***P < 0.001.
Fig. 9.
Fig. 9.
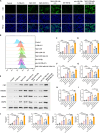
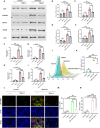
From mitochondrial fission suppression to enhanced ICD: The regulatory axis of NKP-1339 and fission inhibitors in tumor immunogenicity. (A to E) WB analysis of CRT, HMGB1, HSP70, and HSP90 protein expression levels, along with semiquantitative analysis. (F to I) qPCR analysis of CRT, HMGB1, HSP70, and HSP90 mRNA expression levels. (J and K) Flow cytometry analysis of CRT expression levels and quantitative analysis. (L to N) Representative immunofluorescence images showing Drp1 (red), calreticulin (CRT, green), and nuclei (blue) in different treatment groups. White arrows indicate representative tumor cells with synchronous activation , along with semiquantitative analysis. Scale bar = 20 μm. *P < 0.05, **P < 0.01, ***P < 0.001.

Similar articles

References

    1. Sung H, Ferlay J, Siegel RL, Laversanne M, Soerjomataram I, Jemal A, Bray F. Global cancer statistics 2020: GLOBOCAN estimates of incidence and mortality worldwide for 36 cancers in 185 countries. CA Cancer J Clin. 2021;71(3):209–249. - PubMed
    1. Tacar O, Dass CR. Doxorubicin-induced death in tumour cells and cardiomyocytes: Is autophagy the key to improving future clinical outcomes? J Pharm Pharmacol. 2013;65(11):1577–1589. - PubMed
    1. Turajlic S, Swanton C. Metastasis as an evolutionary process. Science. 2016;352(6282):169–175. - PubMed
    1. Park D, Jeon WJ, Yang C, Castillo DR. Advancing esophageal cancer treatment: Immunotherapy in neoadjuvant and adjuvant settings. Cancers (Basel). 2024;16(2):318. - PMC - PubMed
    1. Zhang X, Yu Y, Zhao H, Guo L, Dai K, Lv J. Mechanisms of tumor immunosuppressive microenvironment formation in esophageal cancer. World J Gastroenterol. 2024;30(16):2195–2208. - PMC - PubMed

LinkOut - more resources