

Role of dynamic contrast-enhanced and dynamic susceptibility contrast imaging in evaluating the biological features of glioma
- PMID: 40785876
- PMCID: PMC12332696
- DOI: 10.21037/qims-2024-2794
Role of dynamic contrast-enhanced and dynamic susceptibility contrast imaging in evaluating the biological features of glioma
Abstract
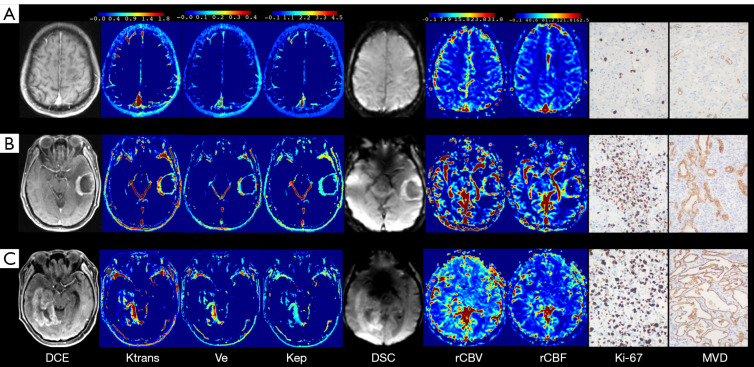
Background: Given the limitations of conventional imaging in accurately grading gliomas, predicting molecular subtypes, and assessing tumor proliferation and angiogenesis, there is a growing need for advanced quantitative magnetic resonance imaging (MRI) biomarkers. This study aimed to compare the diagnostic performance of histogram features of dynamic contrast enhanced (DCE) and dynamic susceptibility contrast (DSC) imaging in predicting glioma grade and genotyping, as well as to explore the association between DCE and DSC with Ki-67 and microvascular density (MVD).
Methods: Forty-six patients with gliomas were enrolled prospectively. The histogram features of DCE and DSC were extracted from the entire tumor and compared among subgroups based on the grades and status of isocitrate dehydrogenase (IDH) mutation and 1p/19q co-deletion. Pearson correlation analyses were employed to examine the associations among Ki-67, MVD, and histogram features of perfusion model. Receiver operating characteristic (ROC) analyses were used to evaluate the accuracy of DCE and DSC in differentiating glioma grades and genotypes, while Cox regression analyses identified prognostic factors associated with survival after surgical resection.
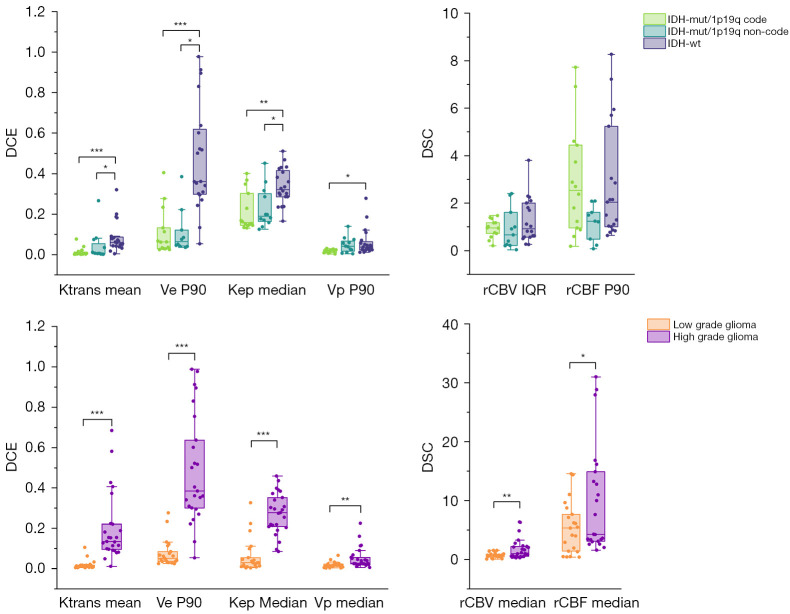
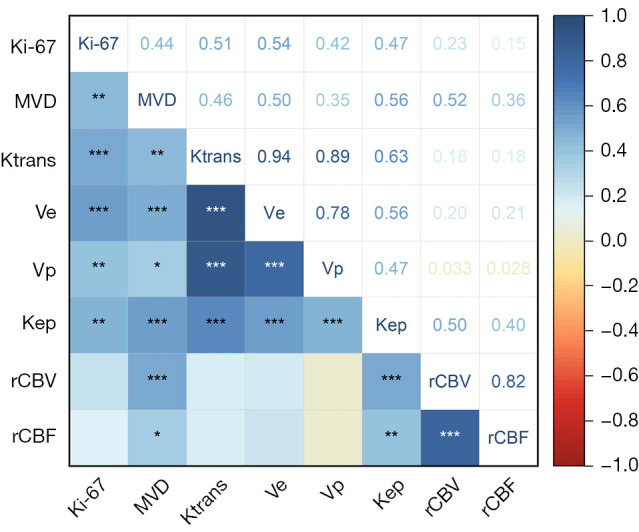
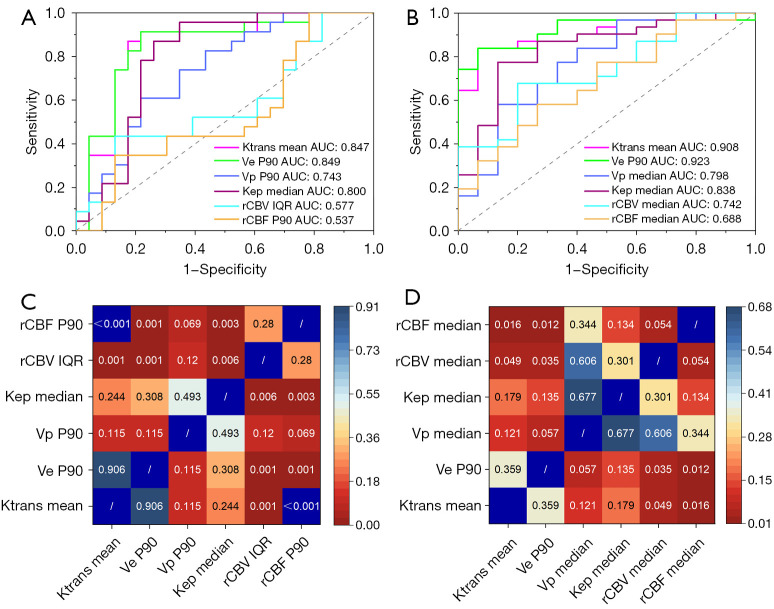
Results: A cohort of 46 patients with IDH-mutant (n=23) and IDH-wildtype (n=23) gliomas was analyzed. DCE-MRI histogram features demonstrated superior performance to DSC parameters in both IDH genotyping and tumor grading. For IDH discrimination, 90th percentile of volume fraction of the extravascular-extracellular space (Ve) [area under the curve (AUC) =0.849, sensitivity 91.3%, specificity 78.3%] and mean value of volume transfer constant (Ktrans) (AUC =0.847, sensitivity 87.0%, specificity 82.6%) showed optimal performance (both P<0.001). In contrast, DSC-derived relative cerebral blood volume (rCBV) (AUC =0.577) and relative cerebral blood flow (rCBF) (AUC =0.537) exhibited limited diagnostic value (P>0.05). In tumor grading, 90th percentile of Ve (AUC =0.923) and mean value of Ktrans (AUC =0.908) achieved near-perfect differentiation (sensitivity 83.9%, specificity 93.3%; P<0.001). While DSC-derived parameters showed improved performance compared to genotyping (rCBV: AUC =0.742, P=0.008; rCBF: AUC =0.688, P=0.040), DCE-based models remained significantly superior (DeLong's test P<0.05 for all comparisons). Significant correlations were observed between DCE parameters and both Ki-67 proliferation index (r=0.42-0.51) and MVD (r=0.35-0.56; all P<0.05). Survival analysis identified three independent prognostic factors: O6-methylguanine-DNA methyltransferase (MGMT) promoter methylation [hazard ratio (HR) =4.15, 95% confidence interval (CI): 1.10-15.68, P=0.04], elevated Ktrans (HR =1.08, 95% CI: 1.01-1.17, P=0.03), and rCBV (HR =1.87, 95% CI: 1.17-2.97, P=0.009).
Conclusions: The histogram features of DCE and DSC demonstrate exceptional diagnostic efficacy in glioma grading, with DCE providing deeper insights into the molecular characteristics of glioma.
Keywords: Glioma genotyping; dynamic contrast enhanced (DCE); dynamic susceptibility contrast (DSC); glioma grade; histogram analysis.
Copyright © 2025 AME Publishing Company. All rights reserved.
Conflict of interest statement
Conflicts of Interest: All authors have completed the ICMJE uniform disclosure form (available at https://qims.amegroups.com/article/view/10.21037/qims-2024-2794/coif). Y.J. serves as a consultant for Siemens Healthineers in the field of MRI scientific support. Siemens Healthineers did not provide direct funding for this study. The other authors have no conflicts of interest to declare.
Figures
References
-
- Sun Y, Yang Z, Deng K, Geng Y, Hu X, Song Y, Jiang R. Histogram analysis of quantitative susceptibility mapping and apparent diffusion coefficient for identifying isocitrate dehydrogenase genotypes and tumor subtypes of adult-type diffuse gliomas. Quant Imaging Med Surg 2023;13:8681-93. 10.21037/qims-23-832 - DOI - PMC - PubMed
LinkOut - more resources
Full Text Sources
Research Materials