

Comparative effects of raw and processed cistanche glycosides on the HPT axis and gut microbiota in a rat model of kidney-yang deficiency
- PMID: 40786034
- PMCID: PMC12331631
- DOI: 10.3389/fphar.2025.1597564
Comparative effects of raw and processed cistanche glycosides on the HPT axis and gut microbiota in a rat model of kidney-yang deficiency
Abstract
Introduction: Kidney Yang Deficiency (KYD) is a metabolic disorder associated with kidney damage. Its slow progression means that causative factors and effective therapeutic agents remain unclear. Extensive evidence links KYD to gut microbiome metabolic diseases and the Hypothalamic-Pituitary-Thyroid (HPT) axis. Cistanche deserticola (CD) is a commonly used traditional Chinese medicine for treating KYD. However, the precise interactions between gut microbiota and KYD, as well as the mechanisms of raw and processed CD total glycosides (CDG) in modulating KYD, require further investigation. This study aims to evaluate the effects and mechanisms of CDG in a KYD rat model using 16S rRNA gene sequencing and fecal metabolomics.
Methods: CDG was extracted from both raw and processed CD and analyzed via HPLC. Propylthiouracil-induced KYD rats were used to assess pharmacological effects, including serum levels of T3, T4, TSH, TRH, FFA, LPL, and NO; organ indices of the spleen, kidney, and thymus; blood cAMP/cGMP levels; and liver levels of glycogen, SDH, Ca2+-ATPase, and Na+-K+-ATPase. Immunohistochemistry was also performed.
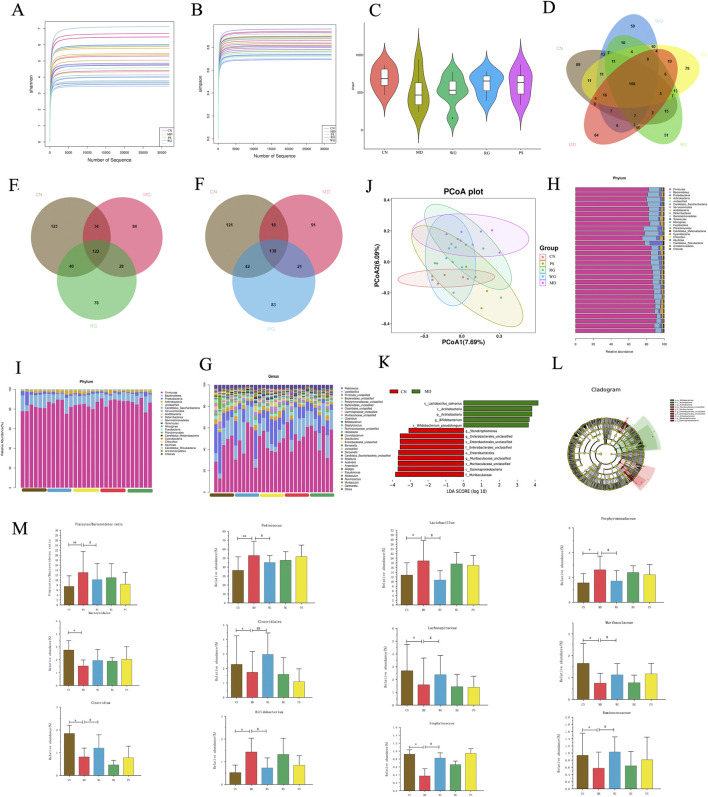
Results: Fecal non-targeted metabolomics identified 98 metabolites associated with KYD, while 16S rRNA sequencing revealed 13 key intestinal microbiotas linked to KYD. CDG therapy effectively alleviated KYD symptoms by modulating the gut microbiota, improving metabolic and microbial imbalances in KYD. RG/WG significantly improves KYD rats mainly through the relationship between the intestinal microbiota and arachidonic acid metabolism. The key bacterial genera lleibacterium and Streptococcus observed in the changes of intestinal flora and fecal metabolite content were significantly negatively correlated with phosphatidylcholine and phosphatidylethanolamine.
Discussion: This integrative approach of gut microbiome and fecal metabolomics not only provides a scientific basis for CDG's preventive effects on KYD via the HPT axis but also elucidates the potential mechanisms underlying CDG's action against KYD.
Keywords: Cistanche deserticola; HPT axis; feces metabolomics; gut microbiota; total glycosides.
Copyright © 2025 Shen, Lian, Zhang, Miu, Zhang, Shi, Xu and Jia.
Conflict of interest statement
The authors declare that the research was conducted in the absence of any commercial or financial relationships that could be construed as a potential conflict of interest.
Figures


Similar articles
-
Exploring the mechanism of Carbonized Typhae Pollen in treating blood stasis syndrome through metabolic profiling: the synergistic effect of hemostasis without blood stasis.J Ethnopharmacol. 2025 Jul 24;351:120124. doi: 10.1016/j.jep.2025.120124. Epub 2025 Jun 11. J Ethnopharmacol. 2025. PMID: 40513921
-
Integrating Gut Microbiome and Metabolomics with Magnetic Resonance Enterography to Advance Bowel Damage Prediction in Crohn's Disease.J Inflamm Res. 2025 Jun 11;18:7631-7649. doi: 10.2147/JIR.S524671. eCollection 2025. J Inflamm Res. 2025. PMID: 40535353 Free PMC article.
-
The effect of Zuogui-Jiangtang-Yishen decoction on the intestinal flora's response to L-α-phosphatidylcholine and L-tyrosine in patients with diabetic kidney disease: an in vitro study.Front Pharmacol. 2025 Jun 11;16:1573514. doi: 10.3389/fphar.2025.1573514. eCollection 2025. Front Pharmacol. 2025. PMID: 40567375 Free PMC article.
-
Pharmacological treatment of children with gastro-oesophageal reflux.Cochrane Database Syst Rev. 2014 Nov 24;2014(11):CD008550. doi: 10.1002/14651858.CD008550.pub2. Cochrane Database Syst Rev. 2014. Update in: Cochrane Database Syst Rev. 2023 Aug 22;8:CD008550. doi: 10.1002/14651858.CD008550.pub3. PMID: 25419906 Free PMC article. Updated.
-
Gut microbiome-based interventions for the management of obesity in children and adolescents aged up to 19 years.Cochrane Database Syst Rev. 2025 Jul 10;7(7):CD015875. doi: 10.1002/14651858.CD015875. Cochrane Database Syst Rev. 2025. PMID: 40637175 Review.
References
-
- Ayu A., Pan W., Huang Z., Zhao L. (2020). The effect of hormones of the hypothalamic-pituitary-target gland axes in a kidney-yang deficiency syndrome model. World J. Traditional Chin. Med. 6, 363–369. 10.4103/wjtcm.wjtcm_38_20 - DOI
Associated data
LinkOut - more resources
Full Text Sources
Miscellaneous