. 2025 Jul 25:19:1544974.
doi: 10.3389/fnbeh.2025.1544974. eCollection 2025.

The protracted neurotoxic consequences in mice of developmental exposures to inhaled iron nanoparticles alone or in combination with SO2

Affiliations

The protracted neurotoxic consequences in mice of developmental exposures to inhaled iron nanoparticles alone or in combination with SO2

Deborah A Cory-Slechta et al. Front Behav Neurosci. .

Abstract

Introduction: Air pollution (AP) has been associated with increased risk for multiple neurodevelopmental disorders. As one of the most abundant contaminants of AP, iron (Fe) is critical to brain function, with both deficiencies and excesses leading to potential neurotoxicity. Our prior studies examining the impact of developmental exposures of mice to inhaled Fe (1.0 μg/m3) alone or in conjunction with sulfur dioxide SO2 (1.31 mg/m3; FeS) from postnatal days (PND) 4-7 and 10-13 (human 3rd trimester brain equivalent period) revealed alterations in brain neurotransmitter levels at PND14 which had generally recovered by PND60, but which were, nevertheless, followed by behavioral impairments. The current study sought to determine whether subsequent behavioral experience, which requires neurochemical mediation, had unmasked residual deficits in neurotransmitter function in response to developmental FeS or Fe inhalation.

Methods: Consequently, levels of brain neurotransmitters and trans-sulfuration markers were measured in mice that had either behavioral experience (BE) or no behavioral experience (NB) at PND 215 (Fe only) or 357 (FeS).

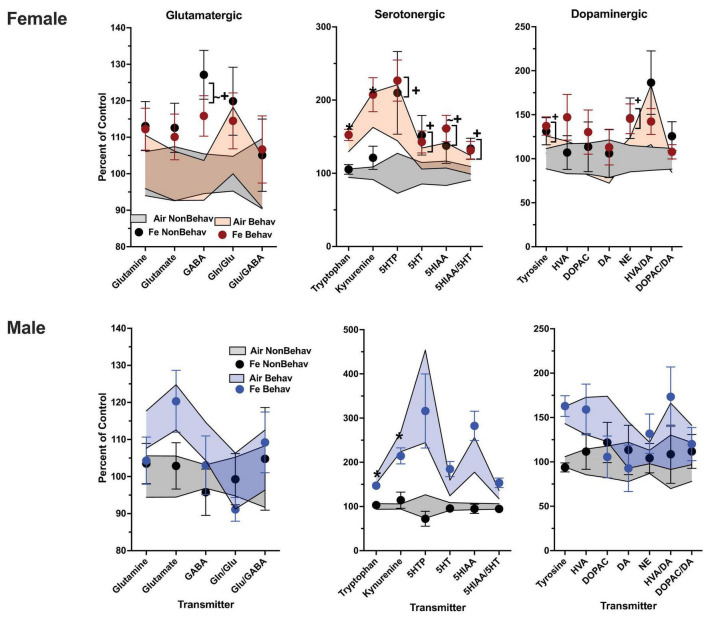
Results: BE itself markedly increased brain neurotransmitter and trans-sulfuration marker levels, particularly in males. These increases were prevented in males in both frontal cortex and striatum by prior developmental FeS exposures. In females, developmental Fe exposure was associated with residual increases particularly in striatal serotonergic function and levels of homocysteine independently of behavioral experience.

Discussion: Collectively, these findings show the ability of behavioral experience to unmask later life residual consequences of developmental exposures to FeS in males and of latent emerging effects of Fe in females. The collective findings may have relevance to later life neurodegenerative diseases and disorders now increasingly associated with air pollution exposures, and also underscore how understanding how various components of air pollution influence brain is critical to regulatory decisions for public health protection.

Keywords: behavioral experience; brain; dopamine; glutamate; iron; serotonin; sulfur dioxide; trans-sulfuration.


Conflict of interest statement

The authors declare that the research was conducted in the absence of any commercial or financial relationships that could be construed as a potential conflict of interest.

Figures

Graphs display neurotransmitter levels in male and female subjects across glutamatergic, serotonergic, and dopaminergic systems. Each system’s chart shows percent control variations for Air NonBehav, FeS NonBehav, Air Behav, and FeS Behav conditions. Female charts show more consistent data compared to males, who exhibit higher variability, especially in serotonergic and dopaminergic measures. Error bars indicate variability.
FIGURE 1
Group mean ± S.E. value of glutamatergic, serotonergic and dopaminergic neurotransmitter levels in frontal cortex for females (top row) and males (bottom row). All data are plotted as percent of Air non-behavior group values: gray shading = air non-behavior control; blue shading = air behavior control; black circles = FeS exposed non-behavioral group; pink circles = female FeS behavioral exposed group; blue circles = male FeS behavioral exposed group. * = significant difference between air behavioral group and air non-behavior group values; += significant difference between FeS group and corresponding air control. Gln/Glu, glutamine/glutamate; Glu/GABA, glutamate/GABA; HVA, homovanillic acid; DOPAC, 3,4-dihydroxyphenylacetic acid; DA, dopamine; NE, norepinephrine; 5HT, serotonin; 5HIAA, 5-hydroxyindoleacetic acid.
Graphs showing neurotransmitter levels in male and female subjects. Top row for females, bottom row for males. Three categories: Glutamatergic, Serotonergic, Dopaminergic. Data for groups: Air NonBehav, FeS NonBehav, Air Behav, FeS Behav. Glutamatergic data range from 80-200, Serotonergic shows spikes, especially in 5HTP, Dopaminergic values range from 50-300.
FIGURE 2
Group mean ± S.E. value of glutamatergic, serotonergic and dopaminergic neurotransmitter levels in striatum for females (top row) and males (bottom row). All data are plotted as percent of Air non-behavior group values: gray shading = air non-behavior control; blue shading = air behavior control; black circles = FeS exposed non-behavioral group; pink circles = female FeS behavioral exposed group; blue circles = male FeS behavioral exposed group. * = significant difference between air behavioral group and air non-behavior group values; += significant difference between FeS group and corresponding air control. Gln/Glu, glutamine/glutamate; Glu/GABA, glutamate/GABA; HVA, homovanillic acid; DOPAC, 3,4-dihydroxyphenylacetic acid; DA, dopamine; NE, norepinephrine; 5HT, serotonin; 5HIAA, 5-hydroxyindoleacetic acid.
Graphs comparing four markers in the frontal cortex and striatum of female and male subjects. The markers are glutathione, homocysteine, cysteine, and methionine. Four conditions are shown: Air NonBehav, FeS NonBehav, Air Behav, and FeS Behav. Data is displayed as percent of control, with separate shaded areas representing each condition.
FIGURE 3
Group mean ± S.E. value of trans-sulfuration markers for females (top row) and males (bottom row) in frontal cortex (left column) and striatum (right column). All data are plotted as percent of Air non-behavior group values: gray shading = air non-behavior control; blue shading = air behavior control; black circles = FeS exposed non-behavioral group; pink circles = female FeS behavioral exposed group; blue circles = male FeS behavioral exposed group. * = significant difference between air behavioral group and air non-behavior group values; += significant difference between FeS group and corresponding air control; * = marginally significant difference between air behavioral group and air non-behavioral group.
Graphs showing neurotransmitter levels in male and female subjects. For females, three plots illustrate glutamatergic, serotonergic, and dopaminergic transmissions, displaying variations in percent of control between different conditions (Air NonBehav, Fe NonBehav, Air Behav, Fe Behav) using error bars. Similar categories are represented for males, with distinctions highlighted by different colors and shading for comparative analysis. The y-axis indicates percent of control, and the x-axis lists transmitters like Glutamine, 5HTP, and Tyrosine.
FIGURE 4
Group mean ± S.E. value of glutamatergic, serotonergic and dopaminergic neurotransmitter levels in frontal cortex for females (top row) and males (bottom row). All data are plotted as percent of Air non-behavior group values: gray shading = air non-behavior control; blue shading = air behavior control; black circles = Fe exposed non-behavioral group; pink circles = female Fe behavioral exposed group; blue circles = male Fe behavioral exposed group. * = significant difference between air behavioral group and air non-behavior group values; += significant difference between Fe group and corresponding air control; ∼+ = marginally significant difference between Fe group and corresponding air control. Gln/Glu, glutamine/glutamate; Glu/GABA, glutamate/GABA; HVA, homovanillic acid; DOPAC, 3,4-dihydroxyphenylacetic acid; DA, dopamine; NE, norepinephrine; 5HT, serotonin; 5HIAA, 5-hydroxyindoleacetic acid.
Graphs comparing neurotransmitter levels in female and male subjects across glutamatergic, serotonergic, and dopaminergic pathways. Female data points are red and black; male data points are blue and black. The x-axis lists neurotransmitters like glutamate and serotonin; the y-axis shows percent of control. Data shows variations with behavioral and control conditions, indicated by shaded areas.
FIGURE 5
Group mean ± S.E. value of glutamatergic, serotonergic and dopaminergic neurotransmitter levels in striatum for females (top row) and males (bottom row). All data are plotted as percent of Air non-behavior group values: gray shading = air non-behavior control; blue shading = air behavior control; black circles = Fe exposed non-behavioral group; pink circles = female Fe behavioral exposed group; blue circles = male Fe behavioral exposed group. * = significant difference between air behavioral group and air non-behavior group values; += significant difference between Fe group and corresponding air control; ∼+ = marginally significant difference between Fe group and corresponding air control. Gln/Glu, glutamine/glutamate; Glu/GABA, glutamate/GABA; HVA, homovanillic acid; DOPAC, 3,4-dihydroxyphenylacetic acid; DA, dopamine; NE, norepinephrine; 5HT, serotonin; 5HIAA, 5-hydroxyindoleacetic acid.
Line graphs compare four groups (Air NonBehav, Fe NonBehav, Air Behav, Fe Behav) in percent control for markers (Glutathione, Homocysteine, Cysteine, Methionine) in the frontal cortex and striatum for females, and in the same markers for males. Female graphs show higher variability, especially in the frontal cortex. Male graphs depict a more moderate variability. Each group is represented by different color-coded markers and lines.
FIGURE 6
Group mean ± S.E. value of trans-sulfuration markers for females (top row) and males (bottom row) in frontal cortex (left column) and striatum (right column). All data are plotted as percent of Air non-behavior group values: gray shading = air non-behavior control; blue shading = air behavior control; black circles = Fe exposed non-behavioral group; pink circles = female Fe behavioral exposed group; blue circles = male Fe behavioral exposed group. * = significant difference between air behavioral group and air non-behavior group values; += significant difference between Fe group and corresponding air control; ∼+ = marginally significant difference between Fe group and corresponding air control.

Similar articles

References

    1. Allen J., Conrad K., Oberdörster G., Johnston C., Sleezer B., Cory-Slechta D. (2013). Developmental exposure to concentrated ambient particles and preference for immediate reward in mice. Environ. Health Perspect. 121 32–38. 10.1289/ehp.1205505 - DOI - PMC - PubMed
    1. Allen J., Liu X., Pelkowski S., Palmer B., Conrad K., Oberdörster G., et al. (2014a). Early postnatal exposure to ultrafine particulate matter air pollution: Persistent ventriculomegaly, neurochemical disruption, and glial activation preferentially in male mice. Environ. Health Perspect. 122 939–945. 10.1289/ehp.1307984 - DOI - PMC - PubMed
    1. Allen J., Liu X., Weston D., Prince L., Oberdörster G., Finkelstein J., et al. (2014b). Developmental exposure to concentrated ambient ultrafine particulate matter air pollution in mice results in persistent and sex-dependent behavioral neurotoxicity and glial activation. Toxicol. Sci. 140 160–178. 10.1093/toxsci/kfu059 - DOI - PMC - PubMed
    1. Allen J., Oberdorster G., Morris-Schaffer K., Wong C., Klocke C., Sobolewski M., et al. (2015). Developmental neurotoxicity of inhaled ambient ultrafine particle air pollution: Parallels with neuropathological and behavioral features of autism and other neurodevelopmental disorders. Neurotoxicology 59 140–154. 10.1016/j.neuro.2015.12.014 - DOI - PMC - PubMed
    1. Anderson G., Frazer D. (2017). Current understanding of iron homeostasis. Am. J. Clin. Nutr. 106 1559S–1566S. 10.3945/ajcn.117.155804 - DOI - PMC - PubMed

LinkOut - more resources