

Functional near-infrared spectroscopy characteristics in children with autism spectrum disorder under animated video modeling therapy
- PMID: 40786629
- PMCID: PMC12331616
- DOI: 10.3389/fneur.2025.1590185
Functional near-infrared spectroscopy characteristics in children with autism spectrum disorder under animated video modeling therapy
Abstract
Objective: To investigate the impact of animated video modeling (AVM) on the brain function of children with autism spectrum disorder (ASD) using functional near-infrared spectroscopy (fNIRS).
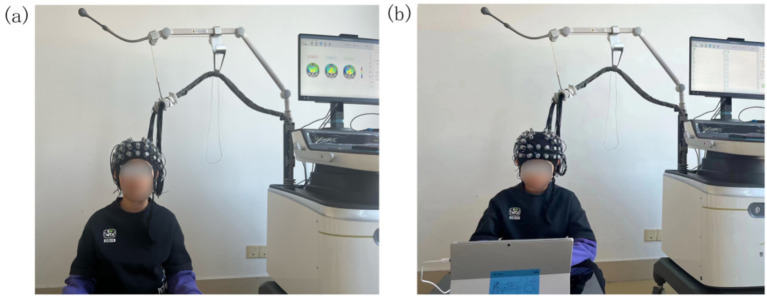
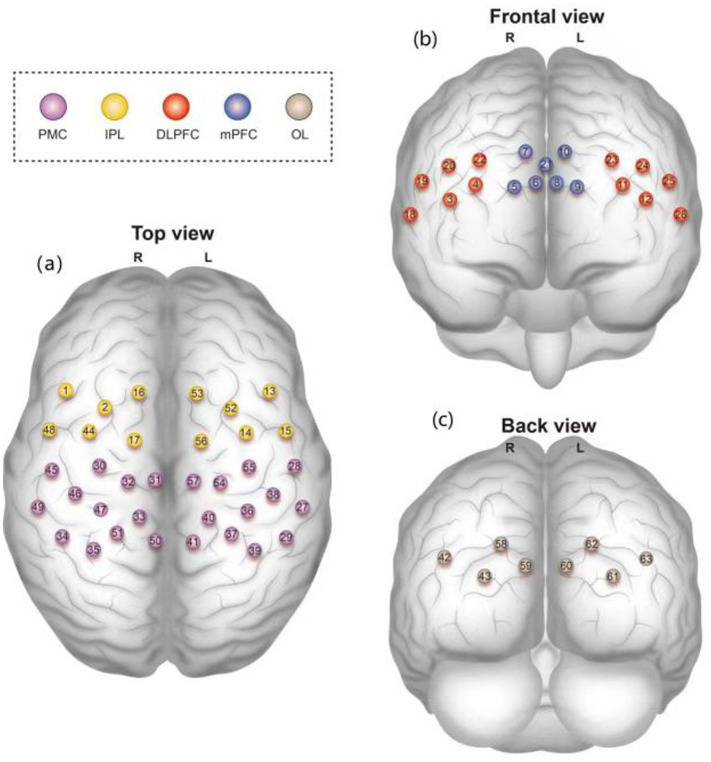
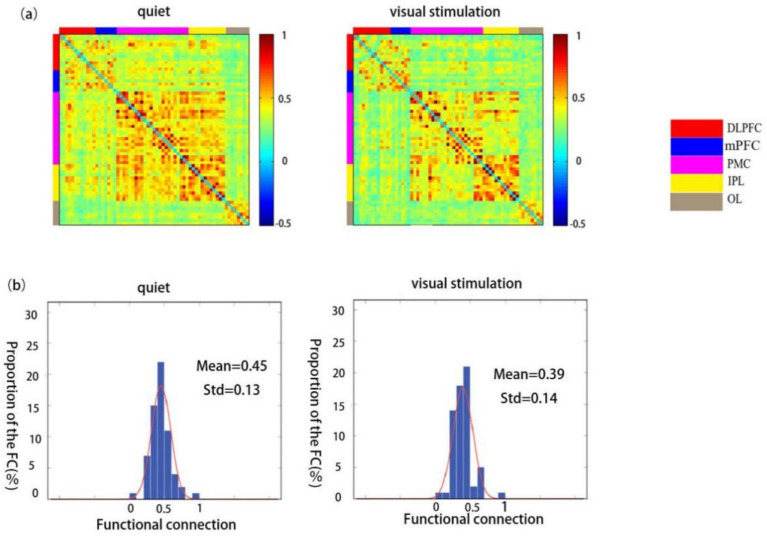
Methods: Fifteen children with ASD and 15 matched typically developing (TD) controls were enrolled. fNIRS was used to obtain 8-min data in quiet and visually stimulated states, with the dorsolateral prefrontal cortex, medial prefrontal cortex (mPFC), and bilateral occipital lobe as regions of interest (ROIs). Based on the concentration of oxygenated hemoglobin (HbO2) over time, correlation coefficient analysis was performed to calculate functional connection strength, and the intergroup disparity was compared.
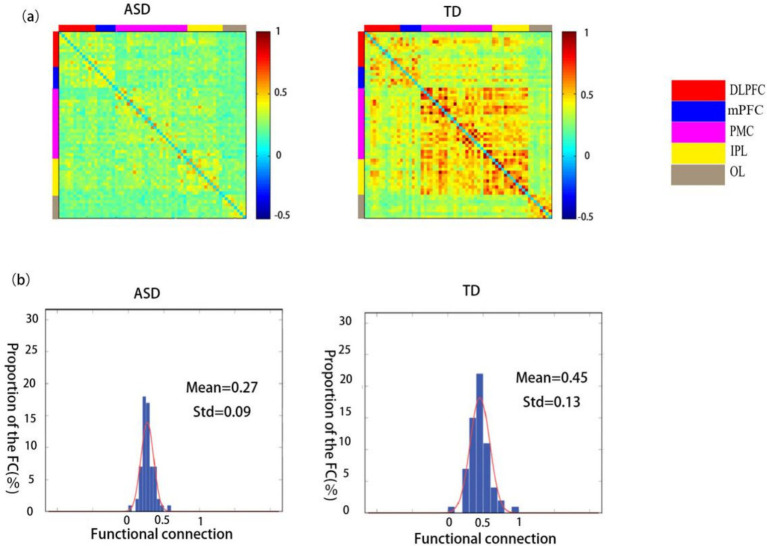
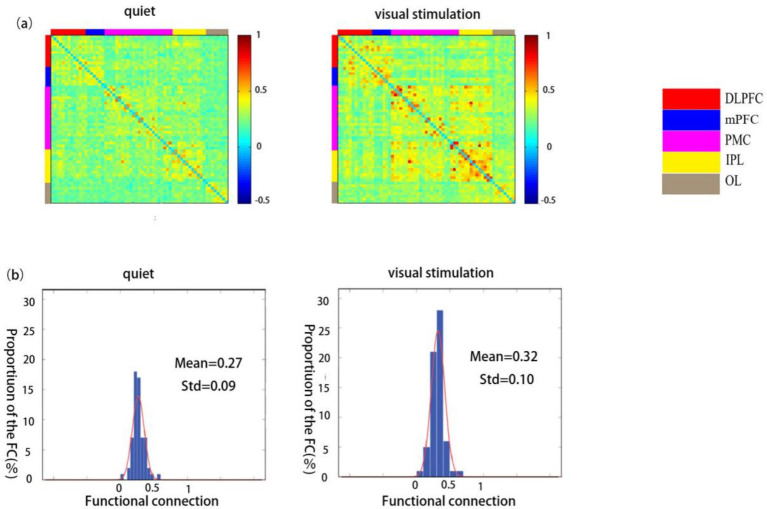
Result: The ASD group showed significantly lower functional connection strength. Comparison of the ROI-ROI functional connectivity strength revealed significant differences in connectivity patterns of the right dorsolateral prefrontal lobe (RDLPFC), left dorsolateral prefrontal lobe (LDLPFC), mPFC, right occipital lobe (ROL), and left occipital lobe (LOL) with other brain regions. Extremely significant differences were found between the RDLPFC/RPMC, ROL/RPMC, LOL/RPMC, and LOL/LIPL. The functional connectivity strength of children with ASD was significantly higher during visual stimulation than during the quiet test. Comparison between the ROI-ROI functional connectivity strengths revealed significant differences in the connectivity strength of the RDLPFC/LOL, LDLPFC/LIPL, mPFC/RPMC, mPFC/LPMC, mPFC/LIPL, ROL/RPM, ROL. RIPL, ROL/LIPL, and LOL/LIPL. Extremely significant differences were observed between the ROL/RPMC and ROL/RIPL.
Conclusion: Animated video modeling can improve visual perception and information processing in children with ASD, by strengthening the functional connectivity between the occipital and inferior parietal cortices.
Keywords: animated video modeling; autism spectrum disorder; brain functional connectivity; functional near-infrared spectroscopy; visual stimulation.
Copyright © 2025 Zhu, Li, Zhang, Liu, Zhang, Huang and Li.
Conflict of interest statement
The authors declare that the research was conducted in the absence of any commercial or financial relationships that could be construed as a potential conflict of interest.
Figures
Similar articles
-
Cortical activation and functional connectivity in patients with chronic insomnia based on working memory tasks: a multi-channel near-infrared spectroscopy study.BMC Psychiatry. 2025 Aug 14;25(1):788. doi: 10.1186/s12888-025-07177-5. BMC Psychiatry. 2025. PMID: 40813976 Free PMC article.
-
The impact of interactive motor-cognitive dual tasking on brain activation, functional connectivity, and behavioral performance in healthy adults: an fNIRS study.Front Hum Neurosci. 2025 Jun 25;19:1464617. doi: 10.3389/fnhum.2025.1464617. eCollection 2025. Front Hum Neurosci. 2025. PMID: 40635721 Free PMC article.
-
Functional connectivity characteristics of epilepsy with anxiety: A resting-state functional near-infrared spectroscopy study.Medicine (Baltimore). 2025 May 30;104(22):e42660. doi: 10.1097/MD.0000000000042660. Medicine (Baltimore). 2025. PMID: 40441208
-
Methylphenidate for children and adolescents with autism spectrum disorder.Cochrane Database Syst Rev. 2017 Nov 21;11(11):CD011144. doi: 10.1002/14651858.CD011144.pub2. Cochrane Database Syst Rev. 2017. PMID: 29159857 Free PMC article.
-
Alterations in brain functional connectivity in patients with mild cognitive impairment: A systematic review and meta-analysis of functional near-infrared spectroscopy studies.Brain Behav. 2024 Apr;14(4):e3414. doi: 10.1002/brb3.3414. Brain Behav. 2024. PMID: 38616330 Free PMC article.
References
-
- American Psychiatric Association . Diagnostic and statistical manual of mental disorders. 5th ed. Arlington,VA, USA: American Psychiatric Association; (2013).
-
- Maenner MJ, Shaw KA, Bakian AV, Bilder DA, Durkin MS, Esler A, et al. Prevalence and characteristics of autism spectrum disorder among children aged 8 years – autism and developmental disabilities monitoring network, 11 sites, United States, 2012(2018). MMWR Surveill Summ. (2021) 70:1–16. doi: 10.15585/mmwr.ss6513a1 - DOI - PMC - PubMed
LinkOut - more resources
Full Text Sources