

Development and Cross-Institutional Validation of a Comprehensive Machine Learning Model Predicting Response to Neoadjuvant Therapy for Rectal Cancer
- PMID: 40786911
- PMCID: PMC12335272
- DOI: 10.2147/CMAR.S517949
Development and Cross-Institutional Validation of a Comprehensive Machine Learning Model Predicting Response to Neoadjuvant Therapy for Rectal Cancer
Abstract
Objective: Accurately identifying patients achieving pathological complete response (pCR) after neoadjuvant chemoradiotherapy (nCRT) for locally advanced rectal cancer (LARC) not only ensures treatment efficacy but also helps avoid surgical risks. We developed a comprehensive multi-omics model to predict pCR before surgery.
Methods: Clinical data, CT, MRI-T1WI and MRI-T2WI, and radiotherapy dose were collected from 183 LARC patients who underwent preoperative nCRT. Backward stepwise selection, logistic regression, and five-fold cross-validation were employed for the development and validation of a non-imaging model, three radiomics-based models and a dosiomics-based model. These were integrated into a final model, and its performance was tested on multi-center sets.
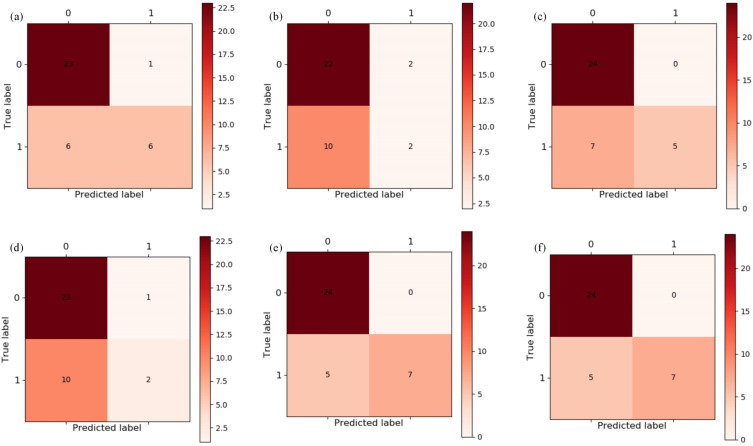
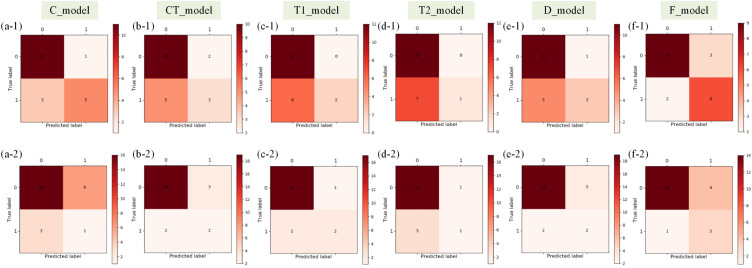
Results: C_model, based on clinical characteristics, achieved an AUC of 0.85 in the validation set. Radiomics models (CT_model, T1_model, T2_model) exhibited AUCs of 0.66, 0.67, and 0.64, respectively. Dosiomics-based model, D_model, achieved an AUC of 0.75 in validation. The mean AUCs for F_model in the training sets, validation sets, internal and external test sets were 0.90, 0.88, 0.77, and 0.74, respectively.
Conclusion: To assess the efficacy of nCRT in LARC patients, it is crucial to consider clinical characteristics, followed by dosiomics. While T1_model, T2_model and CT_model demonstrate relatively comparable performance, each contributes unique value to the final prediction model.
Keywords: dosiomics; nCRT; predict therapy response; radiomics; rectal cancer.
© 2025 Li et al.
Conflict of interest statement
The authors report no conflicts of interest in this work.
Figures


Similar articles
-
A comparative study of machine learning models for predicting neoadjuvant chemoradiotheraphy response in rectal cancer patients using radiomics and clinical features.Medicine (Baltimore). 2025 Jul 4;104(27):e43173. doi: 10.1097/MD.0000000000043173. Medicine (Baltimore). 2025. PMID: 40629575 Free PMC article.
-
Response prediction for neoadjuvant treatment in locally advanced rectal cancer patients-improvement in decision-making: A systematic review.Eur J Surg Oncol. 2025 Jul;51(7):109463. doi: 10.1016/j.ejso.2024.109463. Epub 2024 Nov 15. Eur J Surg Oncol. 2025. PMID: 39562260
-
Comparative analysis of tumor and mesorectum radiomics in predicting neoadjuvant chemoradiotherapy response in locally advanced rectal cancer.Diagn Interv Radiol. 2025 Aug 12. doi: 10.4274/dir.2025.253270. Online ahead of print. Diagn Interv Radiol. 2025. PMID: 40791107
-
A Longitudinal MRI-Based Artificial Intelligence System to Predict Pathological Complete Response After Neoadjuvant Therapy in Rectal Cancer: A Multicenter Validation Study.Dis Colon Rectum. 2023 Dec 1;66(12):e1195-e1206. doi: 10.1097/DCR.0000000000002931. Epub 2023 Sep 8. Dis Colon Rectum. 2023. PMID: 37682775
-
Image-based artificial intelligence for the prediction of pathological complete response to neoadjuvant chemoradiotherapy in patients with rectal cancer: a systematic review and meta-analysis.Radiol Med. 2024 Apr;129(4):598-614. doi: 10.1007/s11547-024-01796-w. Epub 2024 Mar 21. Radiol Med. 2024. PMID: 38512622
References
LinkOut - more resources
Full Text Sources
