. 2025 Jul 25:12:1598038.
doi: 10.3389/fvets.2025.1598038. eCollection 2025.

Association between radiographic equine distal phalanx characteristics and absence, presence and type of horseshoes

Affiliations

Association between radiographic equine distal phalanx characteristics and absence, presence and type of horseshoes

Lisa Henrietta Ennsmann et al. Front Vet Sci. .

Abstract

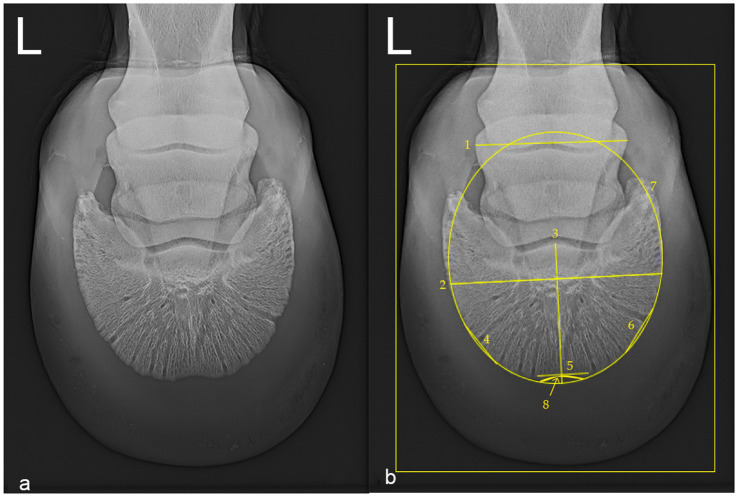
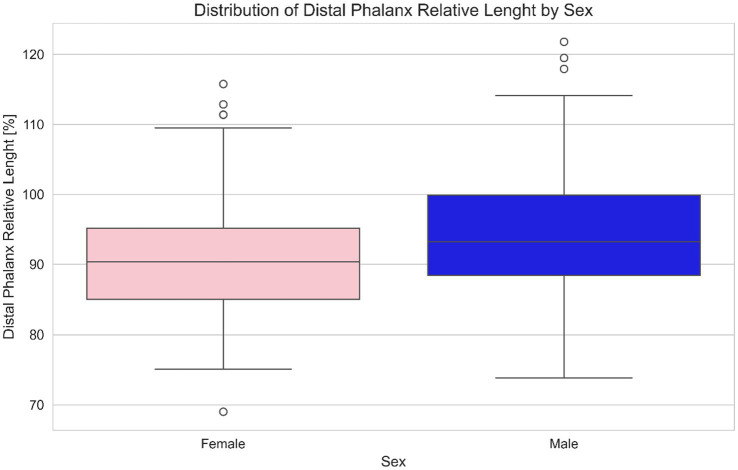
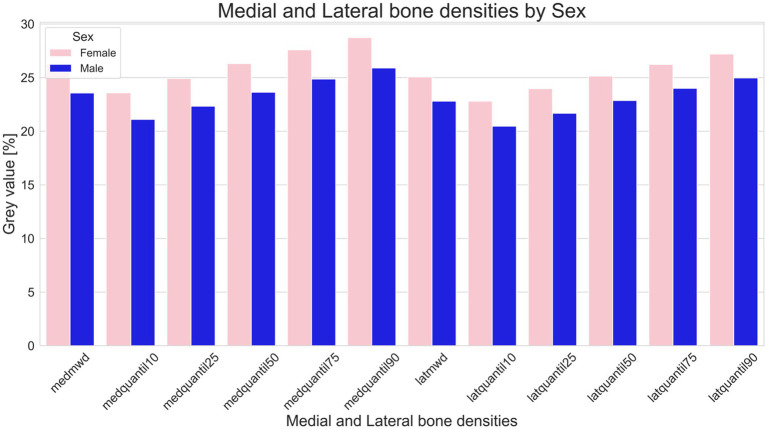
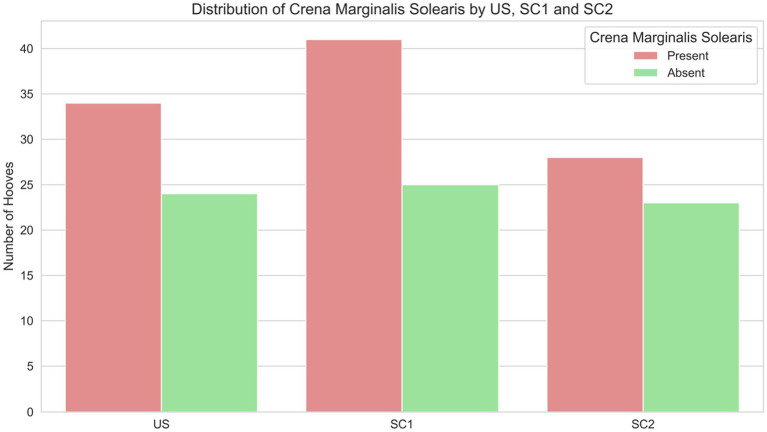
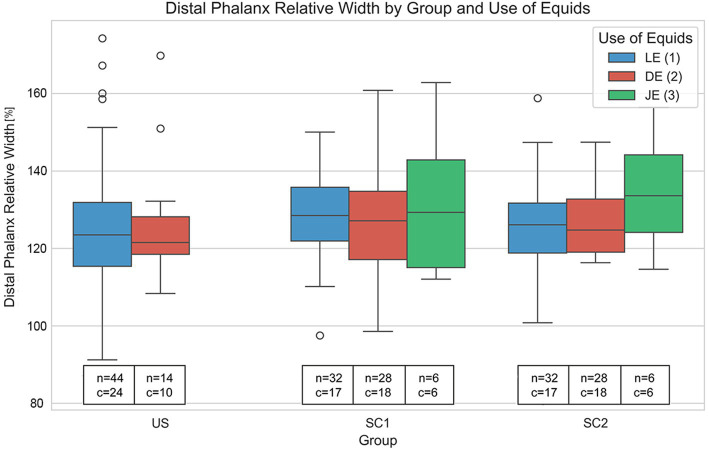
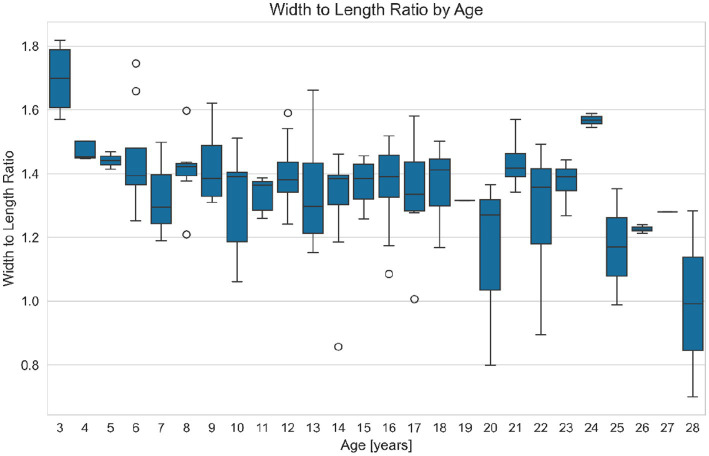
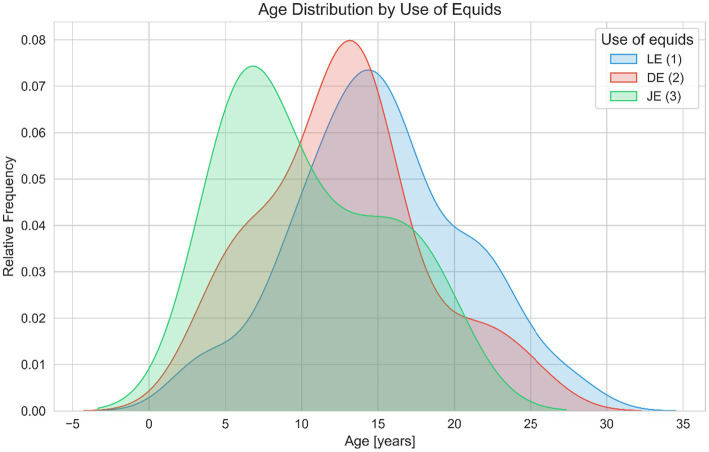
Most horses are used with horseshoes additionally supported by either dorsoabaxial or dorsal clips. The effects of such clips on bone density and shape of the distal phalanx are currently unclear. The aim of this study was to identify correlations between density and shape of the distal phalanx, comparing front hooves unshod or shod with standard shoes either with two dorsoabaxial clips or with a single dorsal clip. Researchers analyzed Oxspring radiographs of either the left or right front hoof from warmblood horses (n = 137) and ponies (n = 43) aged 3-28 years. The evaluation focused on distal phalanx density at the margo solearis, particularly at three locations corresponding to the clip positions: dorsomedial, dorsal, and dorsolateral. The study examined horse related variables such as age, breed, use, and shoeing type in relation to density parameters, presence of a crena marginalis solearis, an anatomical variation that is an indentation dorsal on the margo solearis, and the shape of the distal phalanx. Distal phalanges of hooves shod with dorsoabaxial clips showed a significantly (p < 0.001) lower width to length ratio (median 1.31, minimum 0.70, maximum 1.66) compared to those with a single dorsal clip (median 1.40, minimum 0.89, maximum 1.75). The width to length ratio of unshod hooves (median 1.37, minimum 0.80, maximum 1.82) was not significantly different from both groups of shod hooves. The results of this study should be considered when selecting horseshoes for equids.

Keywords: clips; distal phalanx; horse; horseshoe; radiology.


Conflict of interest statement

The authors declare that the research was conducted in the absence of any commercial or financial relationships that could be construed as a potential conflict of interest.

Figures

Figure 1
Figure 1
Oxspring radiograph (dorsoproximal-palmarodistal projection) of the left front foot of a 4 year old female leisure Warmblood horse (hoof no. 5), belonging to the unshod (US) group (Diagnostic Imaging, Vetmeduni). Lateral is to the left in both images. (a) Native radiograph. (b) Radiograph annotated with measurement lines. The width of the radiographic depiction of the middle phalanx (1; 96.3 mm), the relative width (2; 135.62%) and relative length (3; 91.90%) of the distal phalanx were measured using transverse and sagittal reference lines. Lateral (4; 33.33%), dorsal (5; 33.33%), and medial (6; 33.33%) lines were positioned across the distal phalanx to measure gray values. The width to length ratio (WL ratio) is derived from lines two and three, offering a quantitative representation of the shape of the distal phalanx. The shape of the distal phalanx was subjectively classified as elliptical (7). A crena marginis solearis of the distal phalanx is visible (8). Minimum and maximum bone densities as gray values were recorded within the outlined rectangular measurement area.
Figure 2
Figure 2
Distribution of relative length of the distal phalanx length (%) by sex in equids. This boxplot based comparison highlights potential differences in relative distal phalanx length between male and female subjects. Each box represents the interquartile range (IQR), with the median indicated by a central line and whiskers extending to the full range of data (the circles O represent possible outliers). Pink boxes represent females and blue boxes represent males, offering a clear visual distinction of central tendency, dispersion, and outliers for each sex. One extreme outlier in the male group was ignored for the clarity of the visualization.
Figure 3
Figure 3
Comparison of bone density in male (blue) and female (pink) equids. This figure illustrates variations in as median gray value percentages (indicative of bone density), and the 10th, 25th, 50th, 75th, and 90th Quantile of the medial and lateral distal phalanx density of the distal phalanx. Bars represent the sum of the medial and lateral gray value series (GVS). Sums of GVS were significantly higher in female than in male equids (medial p = 0.007; lateral p = 0.016).
Figure 4
Figure 4
Distribution of presence (red bars) and absence (green bars) of a crena marginalis solearis in distal phalanges of equids of unshod hooves (US), and of hooves shod with a single dorsal clip (SC1), or with two dorsoabaxial clips (SC2).
Figure 5
Figure 5
Variation in relative distal phalanx width (%) across unshod (US), single dorsal clip (SC1), and two dorsoabaxial clips (SC2) groups, further subdivided by use of equids (LE: leisure, DE: dressage, JE: jumping). Each boxplot shows the distribution of relative distal phalanx widths within each category, including median values, interquartile range (IQR), and outliers (O). Text annotations indicate sample sizes (n) and the presence of crena marginalis solearis (c). Notably, individuals with a crena show significantly greater distal phalanx relative width (p = 0.001), independent of US, SC1 and SC2 or use, with warmbloods overrepresented in the group with a crena marginalis solearis. These results highlight the crena as an important determinant of distal phalanx morphology, with potential breed specific effects.
Figure 6
Figure 6
Variation of the distal phalanx width to length ratio (WL ratio, a dimensionless value) with age in equids. This figure presents boxplots of the WL ratio grouped by age, illustrating how hoof proportions change as equids grow older. Each boxplot shows the IQR (Interquartile Range), outliers (O), the range between the first quartile (25th percentile) and the third quartile (75th percentile) of a dataset, with the median value indicated. The results suggest that older equids tend to have a lower WL ratio, and thus a relatively narrower distal phalanx, compared to younger equids.
Figure 7
Figure 7
Age distribution across different uses of equids (leisure LE, dressage DE, and jumping JE). This figure depicts Kernel Density Estimation (KDE) plots of age for LE (blue), DE (red), JE (green). The shaded areas represent the relative frequency of equids within specific age ranges, facilitating visual comparison of age-related demographics across different categories of use. The data suggest that leisure equids tend to be older than those used for jumping or dressage.

Similar articles

References

    1. O’Grady SE, Poupard DA. Proper physiologic horseshoeing. Vet Clin North Am Equine Pract. (2003) 19:333–51. doi: 10.1016/S0749-0739(03)00020-8 - DOI - PubMed
    1. Andrea E, Floyd RAM. Equine podiatry. Bd. Section V: Farriery considerations Philadelphia PA, London: Elsevier Health Sciences; (2007).
    1. Pollitt CC. The anatomy and physiology of the suspensory apparatus of the distal phalanx. Vet Clin North Am Equine Pract. (2010) 26:29–49. doi: 10.1016/j.cveq.2010.01.005, PMID: - DOI - PubMed
    1. Riedesel EA. Chapter 23 the equine phalanges In: Textbook of veterinary diagnostic radiology-e-book. Elsevier Health Sciences (2012). 429.
    1. Malone SR, Davies HM. Changes in hoof shape during a seven-week period when horses were shod versus barefoot. Animals. (2019) 9:1017. doi: 10.3390/ani9121017, PMID: - DOI - PMC - PubMed

LinkOut - more resources