

Mathematical modelling and time series clustering of Mpox outbreak: A comparative study of the top 10 affected countries and implications for future outbreak management
- PMID: 40787209
- PMCID: PMC12332957
- DOI: 10.1016/j.gloepi.2025.100214
Mathematical modelling and time series clustering of Mpox outbreak: A comparative study of the top 10 affected countries and implications for future outbreak management
Abstract
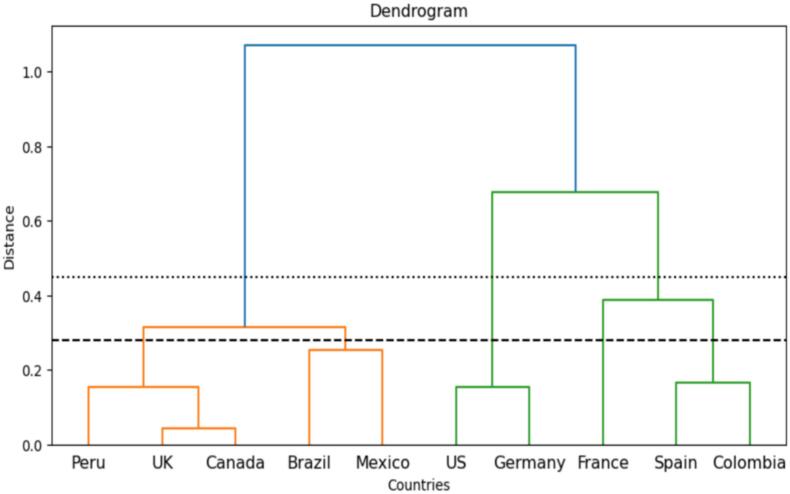
The 2022 Mpox outbreak, characterized by its rapid cross-continental spread beyond traditionally endemic regions, presented a renewed threat to global health security. This study presents a comparative epidemiological analysis of the ten countries most affected by Mpox, integrating mathematical modelling with time series clustering, the first of its kind to analyze the 2022 WHO Mpox data. By applying an SIR-based model to estimate the effective transmission rate, basic reproduction number, time of first infection, and initial susceptible population, the study captures both the pace and persistence of Mpox spread, while critically assessing the effectiveness of national public health responses. Key findings reveal a paradox in North America: Canada exhibited a high transmission rate but a low reproduction number, indicating an elevated transmission potential per contact alongside limited secondary spread. This is likely due to concurrent containment measures or behavioral factors. In contrast, the United States, despite having a lower initial transmission rate, recorded a higher reproduction number. Similarly, Germany exhibited a similar risk trajectory, with elevated reproductive numbers despite robust infrastructure. The cases in the USA and Germany are likely due to systemic health and socio-political policy gaps and delayed behavior-targeted interventions, particularly in the population of men having sex with men (MSM). In Latin America, countries such as Peru and Mexico suffered disproportionately, likely due to limited access to healthcare, which compounded transmission dynamics and reproductive potential. Our study demonstrates that effective Mpox control is not solely dependent on health infrastructure, but also on behavioral targeting, equity, and adaptive health governance. This calls for cross-country and intercontinental collaborations towards combating current and future health shocks, including epidemics.
Keywords: Bootstrapping; Clustering; Dynamic Time Warping; Epidemics; Health shocks; Mpox virus.
© 2025 The Authors.
Conflict of interest statement
The authors declare that they have no known competing financial interests or personal relationships that could have appeared to influence the work reported in this paper. Disclosure of interest The authors report there are no competing interests to declare
Figures


Similar articles
-
Measures implemented in the school setting to contain the COVID-19 pandemic.Cochrane Database Syst Rev. 2022 Jan 17;1(1):CD015029. doi: 10.1002/14651858.CD015029. Cochrane Database Syst Rev. 2022. Update in: Cochrane Database Syst Rev. 2024 May 2;5:CD015029. doi: 10.1002/14651858.CD015029.pub2. PMID: 35037252 Free PMC article. Updated.
-
Sexual Harassment and Prevention Training.2024 Mar 29. In: StatPearls [Internet]. Treasure Island (FL): StatPearls Publishing; 2025 Jan–. 2024 Mar 29. In: StatPearls [Internet]. Treasure Island (FL): StatPearls Publishing; 2025 Jan–. PMID: 36508513 Free Books & Documents.
-
Behavioral interventions to reduce risk for sexual transmission of HIV among men who have sex with men.Cochrane Database Syst Rev. 2008 Jul 16;(3):CD001230. doi: 10.1002/14651858.CD001230.pub2. Cochrane Database Syst Rev. 2008. PMID: 18646068
-
Mpox stigma in the UK and implications for future outbreak control: a cross-sectional mixed methods study.BMC Med. 2025 Jul 15;23(1):422. doi: 10.1186/s12916-025-04243-3. BMC Med. 2025. PMID: 40660139 Free PMC article.
-
A Comparative Analysis of Global Responses to Monkeypox Outbreaks: Lessons Learned and Future Directions - a Mini Narrative Review.Ann Med Surg (Lond). 2025 Jul 16;87(8):5098-5105. doi: 10.1097/MS9.0000000000003577. eCollection 2025 Aug. Ann Med Surg (Lond). 2025. PMID: 40787494 Free PMC article. Review.
References
-
- Olumuyiwa J.P., Oluwatosin B., Mayowa M.O., Omame A. Modelling the transmission of Mpox with case study in Nigeria and Democratic Republic of Congo (DRC) Computational Methods for Differential Equations. 2024;1–19 doi: 10.22034/cmde.2024.62086.2711. - DOI
-
- Ghareeb O.A., Ramadhan S.A. COVID-19-a novel zoonotic disease: Origin, prevention and control. Pak J Med Health Sci. 2021;15:221–223.
-
- Kumar V., Pruthvishree B., Pande T., Sinha D., Singh B., Dhama K., et al. SARS-CoV-2 (COVID-19): zoonotic origin and susceptibility of domestic and wild animals. J Pure Appl Microbiol. 2020;14(Suppl. 1):741–747.
-
- Teklu S.W. Mathematical analysis of the transmission dynamics of COVID-19 infection in the presence of intervention strategies. J Biol Dyn. 2022;16(1):640–664. - PubMed
LinkOut - more resources
Full Text Sources
