. 2025 Jul 29;30(4):464.
doi: 10.3892/ol.2025.15210. eCollection 2025 Oct.

Development and validation of transient receptor potential channel-related signature for predicting prognosis in patients with lung adenocarcinoma

Affiliations

Development and validation of transient receptor potential channel-related signature for predicting prognosis in patients with lung adenocarcinoma

Shennan He et al. Oncol Lett. .

Abstract

Transient receptor potential (TRP) channels are central to human temperature detection and serve a crucial role in cancer development. However, their predictive potential in patients with lung adenocarcinoma (LUAD) remains unexplored. Differential expression analysis of TRP-related genes was performed using The Cancer Genome Atlas and validated using protein-protein interaction networks. Consensus clustering stratified the LUAD subtypes. A four-gene prognostic model of anillin (ANLN), cellular repressor of E1A stimulated genes 2 (CREG2), Ras homolog family member F, filopodia associated (RHOF) and CUB domain containing protein 1 was constructed using least absolute shrinkage and selection operator-Cox regression analysis and validated in Gene Expression Omnibus and IMvigor210 cohorts. Functional enrichment, immune microenvironment analysis and drug sensitivity prediction were performed. Reverse transcription-quantitative PCR demonstrated differential expression of the prognostic genes in a LUAD cell line. A total of 43 TRP-related differentially expressed genes were identified, with consensus clustering (k=2) revealing distinct survival subgroups (P=0.015). High-risk patients exhibited immunosuppressive microenvironments with reduced B-cell infiltration and lower immunotherapy response rates (P=0.021). Functional analysis demonstrated an association of high-risk profiles with mitotic cytokinesis and chemokine signaling. A total of eight chemotherapeutic agents showed differential sensitivity between risk groups. The model outperformed existing signatures using receiver operating characteristic area under the curve and concordance-index analyses. Experimental validation demonstrated elevated expression of ANLN, CREG2 and RHOF in LUAD cells, aligning with the bioinformatics findings. The present study identified a robust TRP channel-related four-gene signature as an independent prognostic biomarker for LUAD, offering insights into immune modulation and personalized therapeutic strategies. The model's predictive accuracy for survival and treatment response underscores its translational potential in clinical decision-making.

Keywords: lung adeno-carcinoma; prognosis; signature; transient receptor potential channel.


Conflict of interest statement

The authors declare that they have no competing interests.

Figures

Figure 1. Differential expressions of the 43 TRP channel–related genes and the interactions among them. (A) Identification of the TRP channel–related genes by taking an intersection of the results fro...
Figure 1.
Differential expressions of the 43 TRP channel-related genes and the interactions among them. (A) Identification of the TRP channel-related genes by taking an intersection of the results from GeneCards database (relevance score >4) and OMIM database. (B) Heatmap depicting the variations in expression of 43 TRP channel-related genes between the normal and tumor samples. P-values are shown as *P<0.05; **P<0.01; ***P<0.001. (C) Protein-protein interaction network showing the interactions of the TRP channel-related genes (interaction score=0.9). (D) The correlation network of the TRP channel-related genes. The red line indicates a positive correlation and the depth of the colors reflects the strength of the relevance. OMIM, Online Mendelian Inheritance in Man; TRP, transient receptor potential.
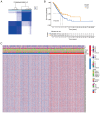
Figure 2. Subgroups of LUAD defined by genes involved in TRP channel. (A) TCGA cohort's consensus score matrix for all samples when k=2. When two samples had a higher consensus score in distinct inter...
Figure 2.
Subgroups of LUAD defined by genes involved in TRP channel. (A) TCGA cohort's consensus score matrix for all samples when k=2. When two samples had a higher consensus score in distinct interactions, they were more likely to be clustered together. (B) Overall survival curves based on patients with LUAD from TCGA cohort for the two TRP channel-related clusters. (C) Consensus clustering of differentially expressed genes in TCGA cohort's two TRP channel-related clusters. *P<0.05. LUAD, lung adenocarcinoma; TRP, transient receptor potential; TCGA, The Cancer Genome Atlas; T, tumor stage; N, lymph node stage; M, metastasis stage.
Figure 3. Prognostic gene signature development using LASSO Cox regression. (A) Forest plot showing the results of the univariate Cox–regression analysis between differentially expressed genes express...
Figure 3.
Prognostic gene signature development using LASSO Cox regression. (A) Forest plot showing the results of the univariate Cox-regression analysis between differentially expressed genes expression and overall survival with 8 genes with a P-value <0.001. (B) Coefficient profiles of genes during LASSO regularization. (C) Partial likelihood deviance (solid line, left axis) and number of non-zero coefficients (dotted line, right axis) versus log(λ). The optimal log(λ) (vertical dashed line) was chosen using the minimum deviance+1 standard error rule. The top axis shows the corresponding Hazard Ratio scale.
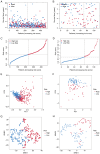
Figure 4. Data distribution of prognostic model using TGCA and GEO databases. (A) Distribution of operating system status in TGCA. (B) The distribution of operating system status in GEO databases. (C)...
Figure 4.
Data distribution of prognostic model using TGCA and GEO databases. (A) Distribution of operating system status in TGCA. (B) The distribution of operating system status in GEO databases. (C) The risk scores' median value and dispersion in TGCA. (D) The risk scores' median value and dispersion in TGCA. (E) Plot of principal component analysis in TGCA. (F) Plot of principal component analysis GEO databases. (G) Examination of the t-SNE coefficients in TGCA. (H) t-SNE coefficients in GEO databases. TCGA, The Cancer Genome Atlas; GEO, gene expression omnibus.
Figure 5. Development of a gene signature to predict patient OS based on clusters associated with TRP channel. (A) Time–dependent ROC analysis of the risk score in TCGA cohort. (B) Time–dependent ROC ...
Figure 5.
Development of a gene signature to predict patient OS based on clusters associated with TRP channel. (A) Time-dependent ROC analysis of the risk score in TCGA cohort. (B) Time-dependent ROC analysis of the risk score in the GEO cohort. (C) OS curves for TCGA cohort's various risk score subgroups. (D) Overall survival curves for the GEO cohort's various risk score subgroups. OS, overall survival, TCGA, The Cancer Genome Atlas; t-SNE2, t-distributed stochastic neighbor embedding; PC, principal component; GEO, gene expression omnibus; ROC, receiver operating characteristic; AUC, area under the curve.
Figure 6. Univariate and multivariate Cox regression analyses for the risk score. (A) TCGA univariate independent prognostic analysis results. (B) TCGA multifactor independent prognostic analysis resu...
Figure 6.
Univariate and multivariate Cox regression analyses for the risk score. (A) TCGA univariate independent prognostic analysis results. (B) TCGA multifactor independent prognostic analysis results. (C) GEO univariate independent prognostic analysis results. (D) GEO multifactor independent prognostic analysis results. (E) Heatmap depicting the clinicopathological characteristics and gene expression variations between the high-risk and low-risk groups. (F) Kaplan-Meier survival curves for high- and low-risk groups in the IMvigor210 cohort (P=0.038). (G) Risk score distribution in IMvigor210 patients stratified by immunotherapy response (CR/PR vs. SD/PD). (H) Receiver operating characteristic curve evaluating the risk score's ability to predict immunotherapy response (AUC=0.592). *P<0.05; **P<0.01; ***P<0.001. TCGA, The Cancer Genome Atlas; GEO, gene expression omnibus; CR, complete response; PR, partial response; SD, stable disease; PD, progressive disease; CI, confidence interval; ANLN, anillin; CREG2, cellular repressor of E1A stimulated genes 2; RHOF, Ras homolog family member F, filopodia associated; CDCP1, CUB domain containing protein 1; T, tumor stage; N, lymph node stage; M, metastasis stage.
Figure 7. Functional analysis based on the differentially expressed genes between the two–risk groups in TCGA cohort. (A) Bubble of Gene Ontology analyses for differentially expressed genes among high...
Figure 7.
Functional analysis based on the differentially expressed genes between the two-risk groups in TCGA cohort. (A) Bubble of Gene Ontology analyses for differentially expressed genes among high and risk groups based on TCGA (the bubble size indicates the number of genes enriched and the color indicates the P-value). (B) Bar plot of Kyoto Encyclopedia of Genes and Genomes analyses for differentially expressed genes among high and risk groups based on TCGA (the bar length indicates the number of enriched genes, while the colors indicate the P-value). TCGA, The Cancer Genome Atlas; BP, biological process; CC, cellular component; MF, molecular function.
Figure 8. Comparison of the single–sample gene set enrichment analysis scores for immune cells and immune pathways. Comparison of the enrichment scores of (A) six types of immune cells and (B) six imm...
Figure 8.
Comparison of the single-sample gene set enrichment analysis scores for immune cells and immune pathways. Comparison of the enrichment scores of (A) six types of immune cells and (B) six immune-related pathways between low- (blue box) and high-risk (red box) groups in The Cancer Genome Atlas cohort. Comparison of (C) immune cells and (D) immune-related pathways between low- (blue box) and high-risk (red box) groups in the Gene Expression Omnibus cohort. P-values are shown as *P<0.05; **P<0.01; ***P<0.001. pDCs, plasmacytoid dendritic cells; TIL, tumor-infiltrating lymphocytes; Treg, regulatory T cells; CCR, chemokine-mediated signaling.
Figure 9. Candidate compounds targeting the four–gene transient receptor potential channel related signature.
Figure 9.
Candidate compounds targeting the four-gene transient receptor potential channel related signature.
Figure 10. Comparison of the model. Comparison of the prognostic model with previously reported models using (A) receiver operating characteristic curves and (B) C–index values. C–index, concordance i...
Figure 10.
Comparison of the model. Comparison of the prognostic model with previously reported models using (A) receiver operating characteristic curves and (B) C-index values. C-index, concordance index; TRP, transient receptor potential; AUC, area under the curve.
Figure 11. Validation of the four–gene TRP channel related signature expression in LUAD cells. (A) Relative mRNA expression of the genes of the TRP channel related signature in LUAD cell lines. * P<0....
Figure 11.
Validation of the four-gene TRP channel related signature expression in LUAD cells. (A) Relative mRNA expression of the genes of the TRP channel related signature in LUAD cell lines. *P<0.05; **P<0.01; ****P<0.0001. (B) Immunohistochemical analysis of the genes of the TRP channel related signature in LUAD tissues from the Human Protein Atlas (www.proteinatlas.org). Data are presented as mean ± SEM. Statistical significance was determined by unpaired two-tailed Student's t-test (n=3 independent experiments). LUAD, lung adenocarcinoma; TRP, transient receptor potential; ANLN, anillin; CREG2, cellular repressor of E1A stimulated genes 2; RHOF, Ras homolog family member F, filopodia associated; CDCP1, CUB domain containing protein 1.

Similar articles

References

    1. Siegel RL, Kratzer TB, Giaquinto AN, Sung H, Jemal A. Cancer statistics, 2025. CA Cancer J Clin. 2025;75:10–45. - PMC - PubMed
    1. Yang C, Liu Y, Huang Z, Liu S, Zhang X, Liu Q, Dai J. Recent advances and challenges of cellular immunotherapies in lung cancer treatment. Exp Hematol Oncol. 2025;14:94. doi: 10.1186/s40164-025-00679-8. - DOI - PMC - PubMed
    1. Lung Cancer. Am Fam Physician. 2022;105:Online. No authors listed. - PubMed
    1. Zhang Y, Luo G, Etxeberria J, Hao Y. Global patterns and trends in lung cancer incidence: A population-based study. J Thorac Oncol. 2021;16:933–944. doi: 10.1016/j.jtho.2021.01.1626. - DOI - PubMed
    1. Allemani C, Matsuda T, Di Carlo V, Harewood R, Matz M, Nikšić M, Bonaventure A, Valkov M, Johnson CJ, Estève J, et al. Global surveillance of trends in cancer survival 2000–14 (CONCORD-3): Analysis of individual records for 37 513 025 patients diagnosed with one of 18 cancers from 322 population-based registries in 71 countries. Lancet. 2018;391:1023–1075. doi: 10.1016/S0140-6736(17)33326-3. - DOI - PMC - PubMed

LinkOut - more resources