. 2025 Jul 25:16:1574783.
doi: 10.3389/fimmu.2025.1574783. eCollection 2025.

Integrated multi-omics for potential biomarkers and molecular mechanism of persistent inflammatory refractory rheumatoid arthritis

Affiliations

Integrated multi-omics for potential biomarkers and molecular mechanism of persistent inflammatory refractory rheumatoid arthritis

Ping-Heng Zhang et al. Front Immunol. .

Abstract

Introduction: Persistent inflammatory refractory rheumatoid arthritis (PIRRA) presents a major clinical challenge, and its underlying molecular mechanisms remain inadequately understood.

Methods: athogenesis. Synovial joint tissues were collected from 30 TgTC mice and 30 Friend virus B (FVB) control mice. Of these, 18 mice per group were used for transcriptomic, proteomic, and metabolomic analyses; 6 for pathological examination and microCT imaging; and 6 for validation experiments. Gene Ontology (GO), Kyoto Encyclopedia of Genes and Genomes (KEGG) pathway analysis, protein-protein interaction networks, and KEGG Markup Language (KGML) network analysis were employed to characterize the functional roles of differentially expressed genes (DEGs), proteins, metabolites, and associated biological pathways. Notably, five genes/proteins-macrophage-expressed gene 1 (Mpeg1), ectonucleotide pyrophosphatase/phosphodiesterase 2 (Enpp2), toll-like receptor 2 (Tlr2), cluster of differentiation 14 (CD14), and lysozyme 2 (Lyz2)-were validated by quantitative reverse transcription PCR (qRT-PCR), Western blotting, and immunohistochemistry.

Results: A total of 2,410 DEGs, 366 differentially expressed proteins, and 120 significantly altered metabolites (P < 0.05) were identified between the model (TgTC ) and control (FVB) groups. These molecules were mainly associated with Golgi apparatus dysfunction, lipid metabolism, and immune-inflammatory responses. Integrative multi-omics analysis further revealed that these molecular alterations are involved in the activation of the PI3K-AKT-mTOR signaling pathway, as well as disruptions in tryptophan and lipid metabolism. Among the metabolites, phosphatidylinositol (PI) (12:0/12:0), N-docosahexaenoyl tryptophan, and PI (22:1(11Z)/0:0) were identified as key metabolic signatures of persistent joint synovitis in TgTC mice. In addition, the expression of Mpeg1, Enpp2, Tlr2, CD14, and Lyz2 was evaluated in synovial samples from patients with PIRRA and classical RA. Notably, Mpeg1, Enpp2, and Lyz2 were significantly upregulated in PIRRA, whereas Tlr2 and CD14 did not show statistically significant differences between groups.

Discussion: Our findings highlight the critical role of altered gene, protein, and metabolite expression in the pathogenesis of PIRRA, offering new insights into its molecular basis and potential therapeutic targets.

Keywords: golgi apparatus; lipid metabolism; multi-omics; persistent inflammatory refractory rheumatoid arthritis; tryptophan metabolism.


Conflict of interest statement

The authors declare that the research was conducted in the absence of any commercial or financial relationships that could be construed as a potential conflict of interest.

Figures

Figure 1
Figure 1
TNF-α induced joint inflammation and bone destruction. (A): Joint swelling in mice. (B): H&E staining. (C): Safranine solid green staining. (D): Toluidine blue staining. (E): Representative microCT images. (F): Body weight. (G): Paw thickness. (H): Arthritis score. (I): Bone analysis parameters. * P < 0.05,** P < 0.01.
Figure 2
Figure 2
Transcriptomics analysis. (A): Principal component analysis of joint synovial tissue samples in NC group and MC group. (B): Volcano map analysis of differentially expressed genes in joint synovial tissues in the NC and MC groups. The gray plots indicate the non-significant genes, while the red and blue plots indicate upregulated and downregulated genes, respectively. (C) KEGG pathway analysis and (D) GO analysis of the top 30 terms associated with the DEGs.
Figure 3
Figure 3
Proteomic analysis. (A): Principal component analysis of joint synovial tissue samples in the NC and MC groups. (B): Volcano map analysis of differentially expressed genes in joint synovial tissues in the NC and MC groups. The gray plots indicate non-significant genes, while the red and blue plots indicate upregulated and downregulated genes, respectively. (C) GO analysis and (D) KEGG pathway analysis based on the differentially expressed proteins identified in the NC and MC groups. E: The top 25 connectivity protein interaction network diagram. Circles represent differential proteins, red represents upregulation, and larger circles indicate higher connectivity.
Figure 4
Figure 4
Integration of transcriptome and proteome datasets. (A): Gene and protein differential expression quadrants. The gray dots represent non-differentially expressed genes and proteins. Purple and blue dots indicate genes and proteins that are simultaneously upregulated or downregulated, respectively. Red and green dots denote discordant expression patterns, where either the gene or protein is upregulated or downregulated. Darker colors reflect statistically significant changes, while lighter shades represent non-significant alterations. (B): Venn map illustrating the overlap between differentially expressed genes and differentially expressed proteins. (C): Bubble map of KEGG enrichment analysis. Larger bubbles indicate pathways containing more differentially expressed protein-coding genes. The bubble color scale ranges from blue to red, with smaller p-values (greater significance) represented by redder hues. (D): KGML interaction network diagram. Each node represents a pathway, with node size corresponding to its degree of connectivity and node color denoting its KEGG classification.
Figure 5
Figure 5
Metabolomic analysis. (A): PCA analysis. (B): Score plots from the OPLS-DA model classifying the MC and NC groups. (C): Clustering heatmap. The color gradient from blue to red indicates increasing expression abundance, with deeper red representing higher abundance. (D): Bubble diagram of KEGG enrichment pathway. Bubble size corresponds to the number of enriched differential metabolites within each pathway. The bubble color gradient from blue to red reflects statistical significance, with smaller P-values indicating greater enrichment significance.
Figure 6
Figure 6
Integration of transcriptome, proteome, and metabolome datasets. (A): Association network diagram of gene-metabolite. (B): The correlation heatmap of the top 20 genes and metabolites. (C): Association network diagram of protein-metabolite. (D): The correlation heatmap of the top 20 proteins and metabolites. (E): KEGG pathway bubble plot of genes-proteins-metabolites. Bubble size indicates the number of differentially expressed components involved in each pathway, while bubble color corresponds to the statistical significance (P-value) of pathway enrichment. F: KGML interaction network diagram in DGEs, DGPs, and differential metabolites. The node name is the pathway name, the node size indicates the connection degree, and the node color is identified by the KEGG class of the pathway.
Figure 7
Figure 7
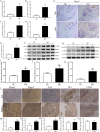
Identification of the target validation. (A–E): Real-time qPCR was used to verify the mRNA expression changes of Mpeg1, Enpp2, Tlr2, CD14, and Lyz2 in joint synovial tissue of TgTC mice. (F, H): Western blotting verified the changes of Enpp2, Tlr2, CD14, Lyz2, and PI3K-AKT-mTOR pathway-related proteins in joint synovium tissue of TgTC mice. (G): Immunohistochemistry verified the level of Mpeg1 protein in joint synovial tissue of TgTC mice. (I–K): the protein expression changes of p-PI3K, p-AKT, and p-mTOR in joint synovial tissue of TgTC mice. (L): Immunohistochemistry verified the level of Mpeg1, Enpp2, Lyz2, Tlr2, and CD14 protein in the synovial tissue of patients. (M–Q): The relative expression of Mpeg1, Enpp2, Tlr2, CD14, and Lyz2 in synovial tissue of patients. * P < 0.05 or ** P < 0.01.

References

    1. Buch MH, Eyre S, McGonagle D. Persistent inflammatory and non-inflammatory mechanisms in refractory rheumatoid arthritis. Nat Rev Rheumatol. (2021) 17:17–33. doi: 10.1038/s41584-020-00541-7, PMID: - DOI - PubMed
    1. Erhardt C, Mumford P, Venables P, Maini R. Factors predicting a poor life prognosis in rheumatoid arthritis: an eight year prospective study. Ann rheumatic diseases. (1989) 48:7–13. doi: 10.1136/ard.48.1.7, PMID: - DOI - PMC - PubMed
    1. Rogers G, Tan Y, Shukla R, Gorodkin R, Parker B, Bruce I, et al. P209 Subgroups of refractory rheumatoid arthritis and difficult to treat features highlight differences in comorbidity and smoking history-a single-centre observational study. Rheumatology. (2022) 61:keac133.208. doi: 10.1093/rheumatology/keac133.208 - DOI
    1. Van Oosterhout M, Bajema I, Levarht E, Toes R, Huizinga T, Van Laar J. Differences in synovial tissue infiltrates between anti–cyclic citrullinated peptide–positive rheumatoid arthritis and anti–cyclic citrullinated peptide–negative rheumatoid arthritis. Arthritis Rheumatism. (2008) 58:53–60. doi: 10.1002/art.23148, PMID: - DOI - PubMed
    1. Savola P, Kelkka T, Rajala H, Kuuliala A, Kuuliala K, Eldfors S, et al. Somatic mutations in clonally expanded cytotoxic T lymphocytes in patients with newly diagnosed rheumatoid arthritis. Nat Commun. (2017) 8:15869. doi: 10.1038/ncomms15869, PMID: - DOI - PMC - PubMed