. 2025 Jul 25:16:1648139.
doi: 10.3389/fimmu.2025.1648139. eCollection 2025.

Mechanistic insights into promotion of non-small cell lung cancer by BAG5 using integrative multi-omics approaches

Affiliations

Mechanistic insights into promotion of non-small cell lung cancer by BAG5 using integrative multi-omics approaches

Jing-Shan Huang et al. Front Immunol. .

Abstract

Introduction: With the continuous emergence of new technologies in omics, the integrative analysis of multi-omics data has become a new direction to explore life mechanisms. The Bcl-2 associated athanogene (BAG) family consists of co-chaperones involved in various cellular processes, including stress signaling, cell cycle regulation, and tumorigenesis. BAG5, a unique member of this family, contains multiple BAG domains, yet its role in non-small cell lung cancer (NSCLC) remains largely unexplored.

Methods: In this study, we employed a multi-omics approach, integrating single-cell transcriptomics, proteomics, interactomics, and phosphoproteomics data to comprehensively investigate BAG5 function in NSCLC. Functional analyses were performed using cell lines and patient-derived organoids (PDOs) to validate our findings.

Results: Our results demonstrate that BAG5 plays a critical role in the regulation of RNA metabolism, mitochondrial dynamics, and metabolic reprogramming. Additionally, BAG5 is involved in cytoskeletal remodeling and epithelial-to-mesenchymal transition (EMT), contributing to the proliferation and invasion of NSCLC cells.

Discussion: These findings underscore the potential oncogenic role of BAG5 in NSCLC, revealing that it acts through multiple molecular pathways. Our study suggests that targeting BAG5 could be a promising therapeutic strategy for treating NSCLC.

Keywords: BAG5; EMT; NSCLC; metabolic reprogramming; multi-omics.


Conflict of interest statement

The authors declare that the research was conducted in the absence of any commercial or financial relationships that could be construed as a potential conflict of interest.

Figures

Figure 1
Figure 1
Involvement of BAG5 interactome in regulation of actin cytoskeleton, focal adhesion and RNA metabolism. (A) Coomassie blue staining of SDS-PAGE gel analyzed BAG5 immunocomplex from a panel of immortalized lung epithelial and NSCLC cell lines. (B) SDS-PAGE gel from lung epithelial cell line BEAS-2B and NSCLC cell line A549 were identified by mass spectrometry. Ten members of Hsp70/HSC70 family were identified to interact with BAG5 in A549 cell. (C) Venn diagram showed the different interacting proteins between BEAS-2B and A549 cell. (D, E) GO (D) and KEGG pathways (E) enrichment analysis of 130 unique BAG5-interacting proteins in A549 cell. (F, G) Cytoscape ClueGO visualizing the enriched pathways of TOP 100 (F) and TOP 5 (G) hub proteins unique in A549 cell. (H) Co-IP was performed to confirm the potential interaction of BAG5 with the top 5 of BAG5-interacting proteins influencing protein translation. (I) BAG5-interacting proteins were analyzed by western blot analysis.
Figure 2
Figure 2
BAG5 was highly expressed in tumor epithelial cells and correlated with NSCLC metastasis. (A, B) Expression levels of BAG5 in tumor versus normal tissues were analyzed using a combined TCGA and GTEx dataset. Comparisons include lung adenocarcinoma (LUAD) and lung squamous cell carcinoma (LUSC), as well as subgroups with lymph node (N) or distant metastasis (M). ***p < 0.001; The statistical difference of two groups was compared through the Wilcox test, significance difference of three groups was tested with Kruskal-Wallis test. (C) Kaplan-Meier survival curve was constructed for NSCLC patients from TCGA based on BAG5 expression levels (BAG5-High vs. BAG5-Low). Significance (p) was evaluated by Log-rank test. HR: hazard ratio. (D) Forest plot of hazard ratios (HR) for the association of BAG5 expression with overall survival (OS) across 27 NSCLC datasets from the OSluca online database. Detailed statistics, including HR, 95% CI, and p-values for each dataset, are provided in Supplemental Table OSluca. (E–G) The public single-cell RNA-seq dataset (GSE119911) was reanalyzed. BAG5 expression levels across major cell types in NSCLC versus normal lung tissues are shown. In panel H, average expression levels of BAG5 are presented as a heatmap across annotated cell types. (H) Western blotting analysis was performed to examine BAG5 expression in a panel of normal and NSCLC cell lines, with GAPDH used as the loading control. Representative immunoblots are shown (upper), and densitometric quantification of relative BAG5 protein levels normalized to GAPDH is presented (lower). Statistical significance was evaluated using one-way ANOVA, ****p < 0.0001. (I) BAG5 protein level was investigated using Western blot in paired fresh NSCLC tumor (T) and paratumor (P) normal tissues, and representative images were provided. β-actin was used as a loading control. LUAD (J) Scatter plots showing relative expression of BAG5 in paired NSCLC tumor (T) and paratumor (P) normal tissues. **p < 0.01.
Figure 3
Figure 3
BAG5 knockout inhibited proliferation and invasion of NSCLC in vitro and in vivo. (A, B) Control and BAG5 knockout NSCLC cells were injected subcutaneously on the right flanks of nude mice (n = 5-6 mice per group). Tumors of each group were removed and photographed after sacrifice of animals. Tumor weight and volumes (mean ± SD) were analyzed. *p < 0.05. (C) Xenografts were sectioned and stained with BAG5 and Ki67. Scale bars, 25μm. (D, E) To evaluate spontaneous metastasis, BAG5 knockout and control A549 cells were i.v. injected to nude mice (n = 8 mice per group). Representative images (D left), quantified values (D right) and H&E staining (E) of metastatic nodules in lung. **p < 0.01. Scale bars, 2mm and 250μm. (F) H&E and immunohistochemical staining images of NSCLC cancer tissues, PDX and derived PDO. Scale bars, 50 µm. (G) To evaluate heterogeneous expression of BGA5 in tumor, the constructed PDOs were separated with a filter with 100μm pore size and BAG5 expression was investigated using histochemical staining. (H) The PDO (PDO#1) with higher basal BAG5 expression were infected with gRNA guided BAG5 using CRISPR/Cas9 system for knockout. Western blot analysis confirming effective BAG5 knockout in PDO#1. β-actin was used as a loading control. (I) Control and BAG5 knockout PDOs were seeded and maintained for 1 week. Representative photographs (left) of colony formation and their quantitative analysis (right) were presented. Data represent the mean ± SD of three independent experiments. Statistical significance was assessed by unpaired two-tailed Student’s t-test; **p < 0.001. (J) Invasion of cells to the lower compartment and chemotaxis of the upper compartment organoids was evaluated by Matrigel-uncoated Transwell. Representative photographs (left) and their numbers (right). These data show mean ± SD of three independent experiments. *p < 0.05.
Figure 4
Figure 4
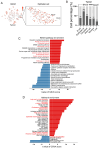
Enrichment of hallmark genes involved in EMT and metabolic reprogramming in BAG5+ NSCLC tumor cells. (A) The t-SNE plot of BAG5 expression landscape in NSCLC tumor tissues. Heterogeneity in the expression of BAG5 was shown in tumor epithelial cells. (B) The relative proportion of BAG5+ cells from different cell types in NSCLC tissues. (C, D) Single sample GSVA (ssGSVA) analysis (BAG5+ vs. BAG5- tumor epithelial cells) showing most enriched KEGG pathways (C) and Hallmark annotation (D).
Figure 5
Figure 5
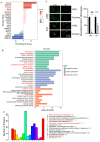
Enrichment of BAG5-regulated proteome in focal adhesion and EMT. (A) Volcano plots of DEGs from quantitative proteomics by comparing control and BAG5 knockout A549 cells. Differential gene expression was defined by p value< 0.05 and a log2FC>|0.6|. (B, C) GO (B) and KEGG pathways (C) enrichment analysis of DEGs. (D) Key hub molecules of BAG5-regualted proteome involving EMT were visualized by Cytoscape. (E) Western blot analysis was performed to confirm BAG5-regulatory EMT hub molecules. *p < 0.05.
Figure 6
Figure 6
Enrichment of phosphorproteome affected by BAG5 in RNA metabolism, focal adhesion and cytoskeleton. (A) KSEA (kinase set enrichment assay) of quantitative phosphorproteomic data. (B, C) GO (B) and COG (C) enrichment analysis of DEGs. (D) HPG incorporation assay for nascent protein synthesis analysis. Quantified fluorescence intensity of HPG signal is shown at the bottom (mean ± SD, n = 3, *p < 0.05, Student’s t-test). Scale bars, 50 μm.
Figure 7
Figure 7
Regulation of metabolic reprogramming by BAG5 in NSCLC. (A) Heat map of differentially expressed proteins including metabolic reprogramming, EMT and mitodynamics-related ones in CON and BAG5-KD A549 cells by quantitative proteomics. (B) Downregulation of GLUT3 by BAG5 knockout was confirmed by western blot analysis in NSCLC cells. (C) Glucose uptake by NSCLC cells was analyzed by 2-NBDG incorporation experiments. (D, E) OCR (D) and ECAR (E) were measured using seahorse instrument in control and BAG5 knockout A549 and PC9 cells. (F, G) Glucose consumption (F) and lactate production (G) was analyzed by spectrophotometric methods. Data represent mean ± SD; *p < 0.05.
Figure 8
Figure 8
Regulation of mitochondrial dynamics by BAG5 in NSCLC. (A) co-expression of BAG5 and DRP1 transcripts was explored using the single cell transcriptome. (B) Regulation of NFN2 and DRP1 by BAG5 in NSCLC cells was investigated via western blot analysis. (C) Representative images of the mitochondrial morphological change by mitotracker staining in A549 cells with control or BAG5 knockout (left). The proportion of cells (n = 100 cells for each sample) with fragmented, intermediate and elongated mitochondria was quantifified (right).Scale bars, 1 μm or 2 μm. (D) MFI of mitotracker staining was measured using flow cytometry in control or BAG5 knockout NCSCLs. (E) Representative TEM images of A549 cells confirmed the mitochondrial morphological changes by BAG5 downregulation. (F) Cells with control or BAG5 knockout were incubated with 10 μM DCFH-DA for 30 min. The MFI of intracellular ROS level was measured with flow cytometry. Data represent mean ± SD; *p < 0.05; n.s. means no significance (Student’s t test). (G) A proposed model for function and mechanism of BAG5 in NSCLC. Based on the multi-omics data, BAG5, as an oncogene, was shown to affect the malignant phenotype of NSCLC cancer cells, and participate in multiple tumor pathways, including regulation of mitochondrial morphology, metabolic reprogramming, RNA metabolism, cytoskeleton, and EMT, which consequently promoting tumor growth and metastasis.

Similar articles

References

    1. Siegel RL, Giaquinto AN, Jemal A. Cancer statistics, 2024. CA Cancer J Clin. (2024) 74:12–49. doi: 10.3322/caac.21820, PMID: - DOI - PubMed
    1. Leiter A, Veluswamy RR, Wisnivesky JP. The global burden of lung cancer: current status and future trends. Nat Rev Clin Oncol. (2023) 20:624–39. doi: 10.1038/s41571-023-00798-3, PMID: - DOI - PubMed
    1. Mariotto E, Viola G, Zanon C, Aveic S. A bag’s life: every connection matters in cancer. Pharmacol Ther. (2020) 209:107498. doi: 10.1016/j.pharmthera.2020.107498, PMID: - DOI - PubMed
    1. Doong H, Vrailas A, Kohn EC. What’s in the ‘Bag’? - a functional domain analysis of the bag-family proteins. Cancer Lett. (2002) 188:25–32. doi: 10.1016/s0304-3835(02)00456-1, PMID: - DOI - PubMed
    1. Takayama S, Reed JC. Molecular chaperone targeting and regulation by bag family proteins. Nat Cell Biol. (2001) 3:E237–E41. doi: 10.1038/ncb1001-e237, PMID: - DOI - PubMed

MeSH terms

LinkOut - more resources