. 2025;18(8):740-746.
doi: 10.1038/s41561-025-01746-9. Epub 2025 Jul 30.

Outburst of a subglacial flood from the surface of the Greenland Ice Sheet

Affiliations

Outburst of a subglacial flood from the surface of the Greenland Ice Sheet

Jade S Bowling et al. Nat Geosci. 2025.

Abstract

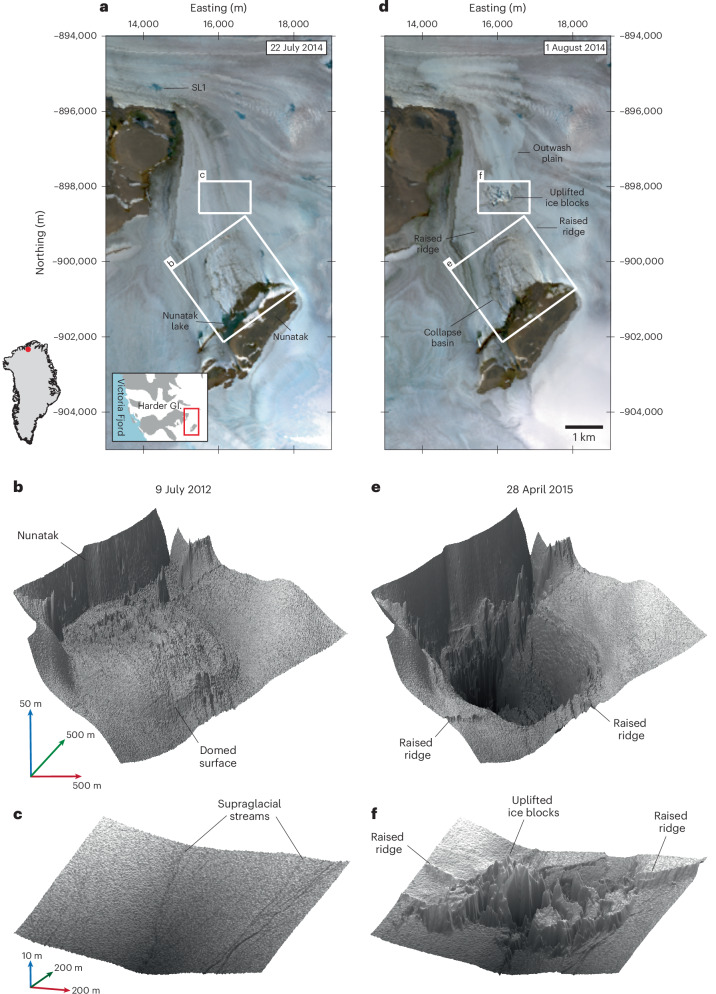
As Earth's climate warms, surface melting of the Greenland Ice Sheet has intensified, increasing rates of sea-level rise. Observations and theory indicate that meltwater generated at the ice sheet surface can drain to its bed, where it flows relatively unhindered to the ocean. This understanding of water movement within and beneath ice sheets underpins the theoretical models that are used to make projections of ice sheet change. Here we present evidence of a destructive mode of meltwater drainage in Greenland. Using multiple satellite sources, we show that a 90-million-cubic-metre subglacial flood forced its way upwards from the bed, fracturing the ice sheet, and bursting through the surface. This phenomenon was triggered by the rapid drainage of a subglacial lake and occurred in a region where the ice bed was predicted to be frozen. The resulting flood caused a rapid deceleration of the downstream marine-terminating glacier. Our observations reveal a complex, bi-directional coupling between the ice sheet's surface and basal hydrological systems and demonstrate that extreme hydrological forcing may occur in regions of predicted cold-based ice. Such processes can impact the ice sheet's dynamics and structural integrity but are not currently considered in ice sheet models.

Keywords: Cryospheric science; Hydrology.


Conflict of interest statement

Competing interestsThe authors declare no competing interests.

Figures

Fig. 1
Fig. 1. Observations of subglacial lake drainage and surface outburst.
a, True colour composite Landsat-8 scene acquired on 22 July 2014 before the subglacial-outburst flood (SL1 indicates the location of a supraglacial lake referred to in the text; white boxes locate the regions shown in b, c, e, and f). Inset: the location of a (red box) relative to the Harder Glacier (Gl.) and Victoria Fjord. b, Three-dimensional shaded relief of the collapse basin mapped before lake drainage, using 2-m-resolution ArcticDEM data acquired on 9 July 2012. c, Three-dimensional shaded relief of the downstream region on 9 July 2012. d, True colour composite Landsat-8 scene acquired immediately after the subglacial lake drainage and surface outburst on 1 August 2014. e, Three-dimensional shaded relief of the collapse basin acquired on 28 April 2015, after the subglacial lake drained. f, Three-dimensional shaded relief of the same downstream region on 28 April 2015, showing ice fractures and uplifted ice blocks. Landsat-8 data in a and d from https://earthexplorer.usgs.gov and ArcticDEM data in b, c, e and f from https://data.pgc.umn.edu/elev/dem/setsm/ArcticDEM.
Fig. 2
Fig. 2. Changes in ice geometry and structure above the Harder subglacial lake.
a, Repeat elevation profiles A–A′ (location shown in c) from sequences of co-registered ArcticDEM data (solid lines) and ICESat-2 data (dashed line) along ICESat-2 track 1130. b, Repeat elevation profiles B–B′ (location shown in c) along ICESat-2 track 1032, crossing both the lake and the edge of the downstream fracture site (entries marked by asterisks in the legend indicate data from ICESat-2). c, Surface elevation change between 9 July 2012 and 28 April 2015, from repeat ArcticDEM data. d, Sentinel-1 SAR backscatter image acquired after lake drainage (22 January 2015), showing evidence of fracturing of the ice surface. Data in a and b from https://data.pgc.umn.edu/elev/dem/setsm/ArcticDEM and https://nsidc.org, data in c from https://data.pgc.umn.edu/elev/dem/setsm/ArcticDEM, and data in d from https://browser.dataspace.copernicus.eu/.
Fig. 3
Fig. 3. Simulations of thermal conditions downstream of the lake basin edge for different geometric and geothermal heat flux scenarios.
a, Simulated temperature field, T(y, z), for a vertical section through the ice, for a high-end scenario (ice thickness = 300 m and geothermal heat flux = 0.07 W m−2). b, Basal temperature, Tb, at the fracture site as a function of ice thickness and geothermal heat flux. The coloured circles correspond to the parameter choices for the experiments reported in c. c, Temperature profiles at the fracture site for four experiments exploring combinations of H = 50 m, 300 m and G = 0.03, 0.07 W m−2. The black solid and dashed curves plot the corresponding temperature boundary conditions at the edge of the lake basin, for H = 300 m and H = 50 m, respectively, which are defined as a parabolic vertical temperature profile to account for the proximity of the subglacial lake.
Fig. 4
Fig. 4. Conceptual model of the Harder subglacial lake drainage and surface outburst.
The texts associated with blue arrows indicate tentative hypotheses. Note that the graphic is not to scale and the precise angle of flood propagation upwards to the surface remains unknown. Landsat-8 surface imagery data from https://earthexplorer.usgs.gov.
Extended Data Fig. 1
Extended Data Fig. 1. Background climatology derived from the statistically downscaled 1 km resolution RACMO2.3p2 at 81.70°N, 43.97°W, for the period 1988-2022.
a 2 m temperature between 1988-2020. b Daily 2 m temperature for 1990. c Daily 2 m temperature for 2014. d Daily total snowfall (blue) and rainfall (orange) between 1988-2022. e Daily total snowfall and rainfall for 1990. f Daily total snowfall and rainfall for 2014. g Daily total runoff (turquoise) and melt (pink) between 1988-2022. h Daily total runoff and melt for 1990. i Daily total runoff and melt for 2014. The areas of grey shading, highlighted by the red arrows, mark the periods during which lake drainage occurred.
Extended Data Fig. 2
Extended Data Fig. 2. Meltwater sources feeding the Harder subglacial lake.
(a) Mean annual surface run-off over the surface catchment feeding the lake, computed between 2010 and 2019, derived from the statistically downscaled 1 km resolution version of RACMO2.3p2; (b) Mean annual basal run-off over the basal catchment feeding the lake, computed between 2010-2019; (c) Total surface and basal mean annual run-off feeding the lake, computed between 2010-2019; (d) The spatial distribution of the proportion of total run-off feeding the lake, indicating that the majority of run-off was generated in close proximity to the lake; (e) The cumulative distribution of run-off feeding the lake, according to the distance travelled from source. The surface catchment is outlined in blue in panel a, the basal catchment is outlined in red in panel b, and the subglacial lake is outlined in dashed yellow in panels a-d. In panels d and e the pink, blue and green dashed lines indicate distances of approximately 0, 2 and 4 km from the subglacial lake. The background image in panels a-d is a true colour composite acquired by Landsat-8 on 22nd July 2014. Landsat-8 data in ad from https://earthexplorer.usgs.gov.
Extended Data Fig. 3
Extended Data Fig. 3. Strain rate components computed from the ice flow velocity fields.
a. longitudinal, b. shear, and c. transverse strain rates, with each component smoothed using a sliding 5×5 pixel median filter. The green polygon indicates the location of the surface fractures, which coincides with where the longitudinal strain rate (panel a) switches from negative (compressional flow) to positive (extensional flow).
Extended Data Fig. 4
Extended Data Fig. 4. Evolution of the ice surface of the Harder Glacier following the two subglacial lake drainage events in 1990 and 2014.
True colour Landsat 5 and 8 composites showing the evolution of the ice surface of the Harder Glacier following the two subglacial lake drainage events in 1990 and 2014. a Landsat scene showing the study area after the 2014 subglacial lake drainage event on 1st August 2014 b-e. Time series of Landsat 5 images spanning the 1990 lake drainage event. f-i. Time series of Landsat 8 images spanning the 2014 lake drainage event. The 1990 lake drainage event was inferred from visual inspection of Landsat images dating back to 1985, to identify consecutive images that showed evidence of (1) a geometric change, from doming to a depression, in the surface, and (2) the formation of new fractures in the vicinity of the basin. Landsat 5 and 8 data from https://earthexplorer.usgs.gov.
Extended Data Fig. 5
Extended Data Fig. 5. Ice thickness, bed elevation, and subglacial water routing pathways beneath the Harder Glacier.
a. Subglacial water routing pathways beneath the Harder Glacier. The background image is a true colour composite Landsat-8 image acquired on 30th July 2019. The green and blue coloured lines indicate modelled subglacial flow paths for a range of flotation factors, k, as indicated in the legend. The yellow star indicates the location of the Harder subglacial lake, and the yellow oval marks the location of the fracture zone. b. Ice thickness and c. bed elevation across the Harder Glacier region, determined from BedMachine version 3. The yellow star indicates the location of the Harder subglacial lake and the black and white lines delineate the ice sheet margin, based upon the MEaSUREs Greenland Ice Mapping Project (GIMP) Land Ice and Ocean Classification Mask, Version 1 (ref. ). Landsat-8 data in a from https://earthexplorer.usgs.gov.
Extended Data Fig. 6
Extended Data Fig. 6. Change in ice elevation in the vicinity of the collapse basin and terminus position of the main northern lobe of the Harder Glacier.
a. The long-term change in ice elevation in the vicinity of the collapse basin derived from CryoSat-2 (grey line; grey shading indicates the associated uncertainty of the elevation change) and ICESat elevation change (black points), and the 1 km resolution downscaled version of RACMO2.3p2 at the location of the collapse basin (solid blue line) and a regional average (dashed blue line) spanning ice between 500 and 800 m a.s.l. b. Change in the terminus position of the main northern lobe of the Harder Glacier, measured using GEEDiT and MaQiT tools; negative values indicate glacier front retreat, positive values indicate glacier advance. The vertical red lines mark the periods during which lake drainage occurred.
Extended Data Fig. 7
Extended Data Fig. 7. Velocity timeseries for the Harder Glacier.
a. Velocity timeseries for the Harder Glacier between 1988 and 2020, for a location ~ 5 km inland of the ice front. The horizontal extent of each line represents the period between image pairs, and the vertical red lines indicate the timing of the 1990 and 2014 subglacial lake drainage events. b. Weekly-averaged seasonal evolution in velocity for all years excluding 2014 (blue) and for 2014 (turquoise), showing the unusually rapid seasonal deceleration in 2014 following the lake drainage. The yellow lines indicate the bounds of the lake drainage event, and the grey dots mark the individual velocities computed from all image pairs.
Extended Data Fig. 8
Extended Data Fig. 8. Ice geometry and dynamics immediately downstream of the collapse basin.
Ice geometry and dynamics along a profile immediately downstream of the collapse basin, encompassing the region of surface fractures. a. the location of the profile, b. surface and bed elevations from BedMachine version 3, c. ice thickness and associated uncertainty (grey shading) from BedMachine version 3, d. ice velocity, and e. longitudinal strain rate. In panels b-e the green shading indicates the region where ice fracturing is observed at the surface. In panel e the blue and red shading indicate compressional and extensional flow, respectively, the dashed line denotes the longitudinal strain rate, and the solid line is a linear fit to the longitudinal strain rate, showing the large-scale trend across the region of interest. Data in a from https://browser.dataspace.copernicus.eu/.

References

    1. Otosaka, I. N. et al. Mass balance of the Greenland and Antarctic ice sheets from 1992 to 2020. Earth Syst. Sci. Data15, 1597–1616 (2023).
    1. Shepherd, A. et al. Mass balance of the Greenland Ice Sheet from 1992 to 2018. Nature579, 233–239 (2020). - PubMed
    1. Mouginot, J. et al. Forty-six years of Greenland Ice Sheet mass balance from 1972 to 2018. Proc. Natl Acad. Sci. USA10.1073/pnas.1904242116 (2019). - PMC - PubMed
    1. Fox-Kemper, B. et al. in Climate Change 2021: The Physical Science Basis (eds Masson-Delmotte, V. et al.) 1211–1362 (Cambridge Univ. Press, 2021).
    1. Tedstone, A. J. & Machguth, H. Increasing surface runoff from Greenland’s firn areas. Nat. Clim. Change12, 672–676 (2022). - PMC - PubMed

LinkOut - more resources