The Role of Retinal Antigen-Presenting Cells in Spontaneous Retinal Autoimmunity
- PMID: 40787935
- PMCID: PMC12352516
- DOI: 10.1167/iovs.66.11.26
The Role of Retinal Antigen-Presenting Cells in Spontaneous Retinal Autoimmunity
Abstract
Purpose: We reported earlier that induction of spontaneous autoimmune uveoretinitis (SAU) correlated with the recruitment of circulating antigen-presenting cells (APCs) into the retina. Here, we investigated the role of resident retinal APCs on the course of SAU.
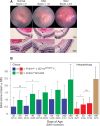
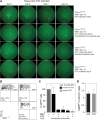
Methods: R161H+/- mice (B10.RIII), which spontaneously and rapidly develop severe autoimmune uveoretinitis, were crossed with CD11cDTR/GFP mice (B6/J). R161H+/- mice on the B6/J background develop slower, less severe SAU than R161H+/--B10.RIII mice, allowing assessment of disease development relative to the depletion or activation of retinal or systemic APCs. The course of SAU was established in a cohort of control R161H+/- × CD11cDTR/GFP F1 mice and then reanalyzed in test cohorts following treatment with diphtheria toxin or stimulation by optic nerve crush (ONC) injury. Analysis was done by retinal imaging, flow cytometry, and histology.
Results: Systemic depletion of APCs halted the progression of SAU in R161H+/- × CD11cDTR/GFP F1 mice and, if commenced early in the disease process, would reduce SAU severity. However, following depletion of APCs specifically from the retina, SAU in R161H+/- × CD11cDTR/GFP F1 mice progressed in a manner similar to that of control mice. In contrast, SAU in R161H+/- × CD11cDTR/GFP F1 mice was exacerbated following the activation of retinal APCs by ONC.
Conclusions: Our observations that local depletion of retinal APCs failed to inhibit SAU progression and that depletion of circulating APCs not only limited SAU progression but also, under defined circumstances, reduced clinical SAU support the idea that circulating APCs are crucial for the induction and progression of SAU.
Conflict of interest statement
Disclosure:
Figures


Similar articles
-
Parabiosis reveals the correlation between the recruitment of circulating antigen presenting cells to the retina and the induction of spontaneous autoimmune uveoretinitis.J Neuroinflammation. 2022 Dec 9;19(1):295. doi: 10.1186/s12974-022-02660-2. J Neuroinflammation. 2022. PMID: 36494807 Free PMC article.
-
Prescription of Controlled Substances: Benefits and Risks.2025 Jul 6. In: StatPearls [Internet]. Treasure Island (FL): StatPearls Publishing; 2025 Jan–. 2025 Jul 6. In: StatPearls [Internet]. Treasure Island (FL): StatPearls Publishing; 2025 Jan–. PMID: 30726003 Free Books & Documents.
-
Vitamin A is necessary for acquisition, but not for expression or progression, of CNS autoimmunity.bioRxiv [Preprint]. 2025 May 23:2025.05.18.654726. doi: 10.1101/2025.05.18.654726. bioRxiv. 2025. PMID: 40492202 Free PMC article. Preprint.
-
Optical coherence tomography (OCT) for detection of macular oedema in patients with diabetic retinopathy.Cochrane Database Syst Rev. 2015 Jan 7;1(1):CD008081. doi: 10.1002/14651858.CD008081.pub3. Cochrane Database Syst Rev. 2015. PMID: 25564068 Free PMC article.
-
Interventions for central serous chorioretinopathy: a network meta-analysis.Cochrane Database Syst Rev. 2025 Jun 16;6(6):CD011841. doi: 10.1002/14651858.CD011841.pub3. Cochrane Database Syst Rev. 2025. PMID: 40522203
References
-
- Sierra A, Paolicelli RC, Kettenmann H.. Cien años de microglía: milestones in a century of microglial research. Trends Neurosci. 2019; 42(11): 778–792. - PubMed
-
- Kierdorf K, Erny D, Goldmann T, et al.. Microglia emerge from erythromyeloid precursors via Pu.1- and Irf8-dependent pathways. Nat Neurosci. 2013; 16(3): 273–280. - PubMed
-
- Ajami B, Bennett JL, Krieger C, McNagny KM, Rossi FM.. Infiltrating monocytes trigger EAE progression, but do not contribute to the resident microglia pool. Nat Neurosci. 2011; 14(9): 1142–1149. - PubMed
-
- Ajami B, Bennett JL, Krieger C, Tetzlaff W, Rossi FM.. Local self-renewal can sustain CNS microglia maintenance and function throughout adult life. Nat Neurosci. 2007; 10(12): 1538–1543. - PubMed
MeSH terms
Grants and funding
LinkOut - more resources
Full Text Sources
Medical
Miscellaneous

