. 2025 Aug 12:10.1158/2159-8290.CD-25-0299.
doi: 10.1158/2159-8290.CD-25-0299. Online ahead of print.

Systematic evaluation of GAPs and GEFs identifies a targetable dependency for hematopoietic malignancies

Affiliations

Systematic evaluation of GAPs and GEFs identifies a targetable dependency for hematopoietic malignancies

Pu Zhang et al. Cancer Discov. .

Abstract

GAPs (GTPase-activating proteins) and GEFs (guanine nucleotide exchange factors) play key roles in cancer development, but their large number and potential redundancy have limited systematic evaluation. Here we perform unbiased genetic screens to identify GAPs and GEFs with cancer- and lineage-specific requirements, as well as dual perturbation screens to dissect functionally relevant interactors of GAPs and GEFs. Application to primary acute myeloid leukemia (AML) patient specimens uncovers the GAP ARHGAP45 as a targetable dependency shared across cancers of hematopoietic origin while being dispensable in normal hematopoiesis. We demonstrate that targeting ARHGAP45-expressing cells can be achieved through TCR-CAR T cells directed at an ARHGAP45-encoded minor histocompatibility antigen and that pharmacologic targeting of GAPs required upon ARHGAP45 depletion augments ARHGAP45-directed cell therapies. These studies provide a resource for probing oncogenic and druggable regulators of GTPases and strategies to target a GAP that represents a shared dependency across blood cancers.


Conflict of interest statement

Competing Interests

The remaining authors declare no competing interests.

Figures

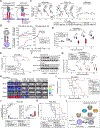
Figure 1.
Figure 1.. Systematic domain-focused CRISPR screens of GAPs and GEFs identify ARHGAP45 as a blood cancer dependency.
(A) Workflow depicting CRISPR-screening-based identification of potential GAPs and GEFs for therapeutic intervention in AML. The grey boxes list the different classes of GAPs and GEFs included in the sgRNA library. (B) Scatter plot comparing in vivo versus in vitro CRISPR screening results of the GAP & GEF library in PDX-2263 cells. The beta score (82), similar to log2 fold change, indicates alteration of cell fitness due to indicative sgRNA knockout (negative: depletion, positive: enrichment). Core fitness/pan-essential genes were defined in Hart et al., 2015(88) and Meyers et al., 2017(15), and are essential for fundamental cellular processes in all cell lines. (C) Scatter plot comparing in vivo versus in vitro CRISPR screening results of the GAP & GEF library in PDX-66 cells. (D) ARHGAP45 CERES across AML, other leukemia, MM, and solid tumor lines extracted from the DEPMAP dataset(15). p values were calculated by Welch’s two-sided t-test. MM, multiple myeloma. CERES, a normalized metric of gene essentiality. (E) Scatter plot depicting the linear correlation between ARHGAP45’s CERE dependency scores and mRNA expression in myeloid and lymphoid (red) or other cancer cell lines (light gray) in the DepMap dataset. Each dot represents one cell line; the shaded regions indicate a 95% confidence interval for the linear regression model in myeloid and lymphoid cell lines. (F) Volcano plot illustrating differentially expressed genes in HSC-like AML cells versus healthy HSCs (data from Van Gallen et al. 2019(16)). Significantly upregulated genes (log2FC > 0.5, p_adj < 0.01) are labeled in red; downregulated genes (log2FC < −0.5, p_adj < 0.01) in blue. (G) Expression of ARHGAP45 in single healthy and malignant cell types. Normalized expression read counts were log-transformed and scaled to unit variance. (H) Single-cell COOTA analysis(24) displaying ARHGAP45 expression.
Figure 2.
Figure 2.. ARHGAP45 is a selective dependency in hematopoietic malignancies.
(A) Competition-based proliferation assays in hematopoietic and solid cancer cell lines infected with indicated sgRNAs linked with GFP. Relative GFP% was normalized to day 3 post-infection (n=3). (B) Competition-based proliferation assays in genetically engineered human MLL-AF9 and FLT3-ITD (MA9-ITD) or NRASG12D (right) transformed AML cell lines(89) (n=4). (C) Correlation analysis of average % of GFP depletion in sgARHGAP45 #3-infected cells on day 21 (in B) versus mRNA expression of ARHGAP45 in indicative cell lines. (D) CRISPRO-based(83)-score-transformed sgRNA fitness scores for ARHGAP45 domain scanning in MOLM-13 cells. (E) Relative growth of cells transduced with indicated sgRNA and sgRNA-resistant cDNA. (n=4).
Figure 3.
Figure 3.. ARHGAP45 is required for AML progression, but dispensable for normal CD34+ hematopoietic stem/progenitor cells (HSPCs) in vivo.
(A)-(C) Quantification of colony numbers of (A) PDX-2263, (B) PDX-60B and (C) PDX-AML17c electroporated with indicated sgRNAs and Cas9 RNP complex on day 12 post seeding. The p-value was calculated using ANOVA with Dunnett’s post hoc test (*p < 0.05). (D) Schema of in vivo engraftment of PDX cells electroporated with sgNeg or sgARHGAP45 #3. (E) Kaplan-Meier survival curves of recipient mice engrafted with PDX-2263 cells electroporated with sgNeg or sgARHGAP45 #3. The p-value was calculated using a log-rank Mantel-Cox test (**p < 0.01). (F) Kaplan-Meier survival curves of recipient mice engrafted with PDX-AML17c cells electroporated with control non-targeting sgRNA (sgNeg) or sgARHGAP45 #3. The p-value was calculated using the log-rank Mantel-Cox test (**p < 0.01). (G) Bioluminescent imaging of mice transplanted with MOLM-13 cells transduced with sgARHGAP45 or sgNeg. (H) Kaplan-Meier survival curves of recipient mice in (G). The p-value was calculated using a log-rank Mantel-Cox test (∗∗p < 0.01). (I) Quantification of colony numbers of human CD34+ HSPCs electroporated with indicated sgRNAs and cas9 RNP complex on day 12 post-seeding. The p-value was calculated using ANOVA with Dunnett’s post hoc test (ns=not significant). (J) Schema of in vivo engraftment of human CD34+ HSPCs electroporated with sgNeg or sgARHGAP45 #3. (K) Immunoblotting of cell lysates of human CD45+ cells isolated from NBSGW mouse bone marrows 16 weeks post-transplant. (L) Quantification of the percentage of human CD45+ cells (left) and hCD45/mCD45 ratio in NBSGW mouse bone marrows 16 weeks post-transplant. (M) Quantification of the percentage of human hematopoietic stem cells (CD34+ CD38), progenitor cells (CD34+ CD38+), and mature cells (CD34 CD38+) in NBSGW mouse bone marrows 16 weeks post-transplant. Box and whisker plots: boxes represent the median, first and third quartiles, with whiskers extending to the 1.5× interquartile range. The p-value was calculated using ANOVA with Dunnett’s post hoc test (ns=not significant).
Figure 4.
Figure 4.. ARHGAP45 regulates cell cycle and constrains AML differentiation.
(A) GSEA analysis of RNA-seq data obtained from MOLM-13 (bottom) cells lentivirally transduced with indicated sgRNAs and collected on day 5 post-infection, and PDX-2263 (up) electroporated with the indicated sgRNAs and collected on day 5 post-transfection. (B) Schema of CITE-seq in PDX and primary patient samples following electroporation of indicated sgRNAs. (C) Cell cycle stages in indicated PDX and primary patient samples. (D) HSC_MPP, myeloid development and malignant AML scores(90) in indicated PDX and primary patient samples. The box plots in the middle of each violin indicate the first and third quartiles, and the central dots indicate the median. The significance of the differences in expression levels was calculated using the Wilcoxon rank-sum test. (E) Projection of CITE-seq data from PDX-133 introduced with indicated sgRNA onto the healthy reference UMAP reconstructed in Supplemental Figure 3I. (F) Bar graphs summarizing the healthy reference projection-based cellular hierarchy of indicated patient-derived cells receiving the specified perturbation using the CITE-seq data.
Figure 5.
Figure 5.. Epistasis screens identify the RhoA pathway as the downstream effector of the ARHGAP45 phenotype.
(A) Scheme depicting the unknown layers of ARHGAP45-mediated suppression of the GTPase pathway and AML differentiation, including GEF, GTPase, and potentially kinase involvement. (B) Epistatic CRISPR-screening strategy to identify GTPase substrates and associated GEFs related to ARHGAP45 function AML as noted in A. Top: sgRNA cassette used for libraries (LRG2.1) and single knockout (mod_LRChe2.1T_neo with a modified U6 promoter to prevent PCR amplification during sgRNA library enrichment). Bottom: scheme of the epistatic CRISPR screens. GAP & GEF, GTPase & Glycosylation, and Kinome-focused CRISPR libraries were individually transduced, followed by single-KO sgRNA transduction and selection of KO cells with neomycin for at least 7 days. Resistance (more enriched in the ARHGAP45-KO condition) and synergizer (more depleted in the ARHGAP45-KO condition) genes were identified by next-generation sequencing. (C)-(E) Scatter plot comparing CRISPR screening results of the (C) GAP and GEF, (D) GTPases & glycosylation, and (E) Kinome libraries in control sgRNA (sgNeg) versus sgARHGAP45 #3-introduced MOLM-13 cells. (Label: red, resistance/suppressor genes; blue, synergizer gene; dark, negative controls; orange, known leukemia-essential or core-fitness genes; purple, genes with no effect). To identify the synergizer/resistance genes, we ranked the β score difference between sgNeg and sgARHGAP45 #3 (Δβ) and considered Δβ > 1 as synergizers and Δβ < −1 as resistance, after filtering out the core fitness genes with β < −3 and negative controls. The purple boxes list the different classes of GEFs and GAPs, GTPases and glycosyltransferases, and kinases included in the sgRNA library.
Figure 6.
Figure 6.. ARHGAP45 suppresses RhoA activity and loss of ARHGAP45 sensitizes AML to CDC42 inhibition.
(A)-(C) Competition-based proliferation assays in MOLM-13 with sequential sgRNA transduction. (A) Negative, (B) ARHGEF1, or (C) RhoA sgRNAs linked with mCherry were infected first, followed by transduction with the indicated sgRNAs linked with GFP. Relative GFP% in the mCherry+ population was normalized to day 3 post-infection (n=3). (D) G-ELISA assay detecting the RhoA-GTP level in cells transduced with indicated sgRNAs or drug treatment. The positive control is MOLM-13 cells treated with a RhoA activator. The p-value was calculated using ANOVA with Dunnett’s post hoc test (ns=not significant). (E) RhoA-GTP pull-down assays followed by immunoblotting of RhoA-GTP and total RhoA in MOLM-13 cells infected with indicated sgRNAs. (F) Competition-based proliferation assays in MOLM-13 cells with EV, RhoA-WT, and a constitutively active mutant of RhoA (Q63L) transduction. The cDNA was linked with mCherry, and the relative mCherry+ population was normalized to day 3 post-infection (n=3). (G) Competition-based proliferation assays in MOLM-13 with sequential sgRNA transduction. Negative (top), or ARHGAP45 (bottom) sgRNAs linked with GFP and puromycin were infected first, followed by puro selection and transduction with the indicated sgRNAs linked with mCherry. Relative mCherry % in GFP+ population was normalized to day 3 post-infection (n=3). (H) CDC42-GTP pull-down assays followed by immunoblotting of CDC42-GTP and total CDC42 in MOLM-13 cells infected with indicated sgRNAs. (I) Representative bioluminescent imaging of mice transplanted with MOLM-13 cells infected with sgNeg or sgARHGAP45 #3 and treated 3 times a week with MBQ-167 (10 mg/kg) or vehicle control, starting from day 7 post-transplant. (J) Kaplan-Meier survival curves of recipient mice in (I). The p-value was calculated using a log-rank Mantel-Cox test (∗∗p < 0.01; ∗∗∗p < 0.001; ∗∗∗∗p < 0.0001).
Figure 7.
Figure 7.. Efficacy of a chimeric antigen receptor-like T cell receptor (CAR-like TCR) targeting an ARHGAP45-derived antigen in AML and enhanced activity via CDC42 inhibition.
(A) Schema of conventional full-length TCR and TCR-CAR against the HA-1H antigen derived from ARHGAP45 in complex with peptide:MHC on the cell membrane of AML cells. (B) T cell proliferation (mCherry count) and tumor proliferation (GFP count) over time upon co-culture of OCI-AML3 isogenic cells and TCR-T cells at an E:T ratio of 1:20. ****p<0.0001 (Kolmogorov-Sirnov test). (C) Box-and-whisker plots of live human CD33+ (“hCD33+”) cells from three distinct primary AML samples co-cultured with the indicated TCR T cells at the indicated E:T cell ratios for 72 hours. ∗∗p <0.05; ∗∗p <0.01; ∗∗∗p <0.001; ∗∗∗∗p <0.0001 (ANOVA with Dunnett’s post hoc test). (D) Quantification of BLI (photons per sec) for mice injected with luciferase-labeled OCI-AML2 cells followed by mCherry control, full-length TCR, or TCR-CAR T cells (Representative BLI images are in Supplemental Figure 7C). The box plots indicate the first and third quartiles, and the central dots indicate the median. The significance of the differences was calculated using the ANOVA followed by Holm-Bonferroni post hoc analysis (*p<0.05; **p<0.01; ***p<0.001; ****p<0.00001; ns=not significant).n=10 mice/group. (E) Kaplan-Meier survival curves of recipient mice in (D). The p-value was calculated using a log-rank Mantel-Cox test (∗∗∗p < 0.001; ns=not significant). (F) Western blot of ARHGAP45 in MOLM-13 and MV4;11 cells in response to MBQ-167 at indicated doses for 24 hours. ARHGAP45-KO cells were used as a negative control. (G) Quantification of BLI (photons per sec) and (H) Representative BLI images of NCG mice transplanted with 100,000 OCI-AML2 cells followed by 1.0×10⁶ mCherry control, 0.5×10⁶ TCR-CAR, or 1.0×10⁶ TCR-CAR targeting HA-1H and treated 3 times a week with MBQ-167 (10 mg/kg) or vehicle control, starting day 3 post-transplant. ∗p <0.05; ∗∗∗∗p <0.0001. ANOVA with Dunnett’s post hoc test. n=10 mice/group. (I) Kaplan-Meier curves of recipient mice in (G). ∗∗p <0.01; ∗∗∗p <0.001; ∗∗∗∗p <0.0001. (J) Frequency of human CD33+ AML cells in total bone marrow cells and mCherry+ (TCR-T) cells amongst human CD45+ cells one month post-engraftment in PDX mice receiving 0.1×10⁶ AML cells and 1×10⁶ mCherry control, full-length TCR, or TCR-CAR T cells. Vehicle or 10 mg/kg MBQ-167 was administered to half the mice per group. n=10 mice/group. (K) Kaplan-Meier curves of PDX mice treated with different TCR-T cells with or without MBQ-167 treatment. Data are presented as mean±SD. The p-value was calculated using ANOVA with Dunnett’s post hoc test (*p < 0.05; ∗∗p <0.01; ∗∗∗p <0.001; ∗∗∗∗p <0.0001; ns=not significant). (L) Model of synergistic anti-cancer activity combining HA-1H-targeted TCR-CAR T cells with CDC42 inhibition in ARHGAP45-positive leukemia.

References

    1. Bement WM, Goryachev AB, Miller AL, von Dassow G. Patterning of the cell cortex by Rho GTPases. Nat Rev Mol Cell Biol 2024;25:290–308. - PubMed
    1. Rossman KL, Der CJ, Sondek J. GEF means go: turning on RHO GTPases with guanine nucleotide-exchange factors. Nat Rev Mol Cell Biol 2005;6:167–80. - PubMed
    1. Kreider-Letterman G, Carr NM, Garcia-Mata R. Fixing the GAP: The role of RhoGAPs in cancer. Eur J Cell Biol 2022;101:151209. - PMC - PubMed
    1. Cronin KA, Scott S, Firth AU, Sung H, Henley SJ, Sherman RL, et al. Annual report to the nation on the status of cancer, part 1: National cancer statistics. Cancer. 2022;128:4251–84. - PMC - PubMed
    1. Saygin C, Zhang P, Stauber J, Aldoss I, Sperling AS, Weeks LD, et al. Acute Lymphoblastic Leukemia with Myeloid Mutations Is a High-Risk Disease Associated with Clonal Hematopoiesis. Blood Cancer Discov 2024;5:164–79. - PMC - PubMed

LinkOut - more resources