. 2025 Oct;12(37):e07080.
doi: 10.1002/advs.202507080. Epub 2025 Aug 11.

Patients-Derived Organoids Sequencing-based FOXP4 Facilitates Radioresistance by Transcriptionally Modifying GPX4 to Regulate ferroptosis in Colorectal Cancer

Affiliations

Patients-Derived Organoids Sequencing-based FOXP4 Facilitates Radioresistance by Transcriptionally Modifying GPX4 to Regulate ferroptosis in Colorectal Cancer

Qianping Chen et al. Adv Sci (Weinh). 2025 Oct.

Abstract

More than 50% of patients with colorectal cancer (CRC) exhibit radioresistance, indicating the need for further research on the disease. Therefore, the aim of this study is to identify radioresistance genes and elucidate the underlying molecular mechanisms using patient-derived organoids (PDOs). Transcriptome analyses are performed on radio-resistant and -sensitive PDOs, CRC cells, and xenograft tissues to screen for radioresistant genes. Additionally, the genetic homology between PDOs and clinical tissues is verified using whole-exome sequencing. Functional experiments are performed to validate the roles of the candidate genes using cellular, organoid, and animal models. Forkhead box P4 (FOXP4) is identified as a differentially expressed genes between the radio-sensitive and -resistant groups that is linked to radioresistance. Further experiments show that FOXP4 promoted radioresistance by suppressing ferroptosis. Mechanistically, FOXP4 regulated GPX4 transcription by binding to the promoter region of GPX4 via the forkhead domain to inhibit the onset of ferroptosis. Doxorubicin (DOX) inhibited FOXP4 expression by promoting its ubiquitination and degradation, eventually increasing radiosensitivity. Notably, DOX combined with irradiation attenuated the compensatory increase in FOXP4 expression and increased radiotherapy efficacy. Conclusively, the combination therapy provides a new strategy for enhancing therapeutic efficacy in CRC.

Keywords: FOXP4; Ferroptosis; GPX4; PDOs; Radioresistance.


Conflict of interest statement

The authors declare no conflict of interest.

Figures

Figure 1
Figure 1
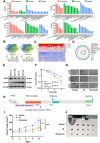
FOXP4 was significantly associated with radioresistance in colorectal cancer. A) The morphology of PDOs with two typical characteristics in bright field (walled cystic structure and solid spherical structure). Scale bar, 200 µm. B) H&E staining and IHC staining of Ki‐67, CK20, β‐catenin, CDX2 and CK‐pan on typical structure CRC PDO (O3: walled cystic structure; O7: solid spherical structure, O refers to PDO). Scale bar, 50 µm. C) Typical MRI images of patients with significant tumor regression (mrTRG 1‐2, P‐20) and patients with insignificant tumor regression (mrTRG 4‐5, P‐38) after radiotherapy, P refers to Patient. D) The mrTRG score of patients after radiotherapy matched organoids survival levels after IR, S refers to radiosensitive PDO, R refers to radioresisitant PDO, M refers to medium response to irradiation. E) Heatmap of gene mutation variations (single‐nucleotide variants, SNVs) in the most frequently mutated genes of rectal cancer. F) Dose responses of survival fractions of HCT116, HCT116R, HCT15 and HCT15R after IR. G) Venn diagram of the co‐expressed DEGs among five groups (Green: HCT116R/HCT116; Yellow: HCT15R/HCT15; Purple: HCT15/HCT116; Blue: PDO‐R/PDO‐S; Pink: Tumor/Normal tissues). * P < 0.05, ** P < 0.01, *** P < 0.001.
Figure 2
Figure 2
Inhibition of FOXP4 significantly enhanced the radiosensitivity of colorectal cancer. A) Representative images and quantification of western blot assay of FOXP4 and β‐actin proteins in HCT116, HCT116R, HCT15 and HCT15R cells. B) Representative images and quantification of IHC staining of FOXP4 on radiosensitive and radioresistant PDOs. n=5. Scale bar, 50 µm. C) Representative images and quantification of IHC staining of FOXP4 on CRC tumor tissues and adjacent normal tissues. n=3. 10X Scale bar, 100 µm; 40X Scale bar, 25 µm. D) Dose responses of survival factions of HCT116 and HCT15 cells with or without shFOXP4 transfection. E) Bright field image and quantitative results of PDO transfected with sgFOXP4 or sgNC after 8Gy irradiation. n=5. Scale bar, 200 µm. F) Pattern plots of nude mice inoculated with shNC or shFOXP4 HCT15 cells that were irradiated at 8Gy*3d and then executed at the appropriate time. G) Tumor volume of shNC, shFOXP4, shNC+IR and shFOXP4+IR groups was examined every 3 days until 9 days after IR. H) General view of tumor mass of each indicated group at 9 days after IR.* P < 0.05,** P < 0.01,*** P < 0.001.
Figure 3
Figure 3
Enhanced ferroptosis resulted in radiosensitization of colorectal cancer. A) GO analysis of DEGs from PDO‐R vs PDO‐S, HCT116R vs HCT116, HCT15R vs HCT15, and HCT15 vs HCT116. Fold change ≥ 1.5 or ≤ 0.67, P‐value < 0.01; B) Venn diagram of the co‐expressed DEGs among above four groups (Blue: PDO‐R/PDO‐S, Green: HCT116R/HCT116, Yellow: HCT15R/HCT15, Purple: HCT15/HCT116). C) Heatmap of co‐expression of DEGs in the above four groups (PDO‐R/PDO‐S, HCT116R/HCT116, HCT15R/HCT15, HCT15/HCT116). D) Pathway enrichment analysis of co‐expressed DEGs in the above four groups (PDO‐R/PDO‐S, HCT116R/HCT116, HCT15R/HCT15, HCT15/HCT116). E) Western blot assay of 4HNE, GPX4, and β‐actin proteins in HCT116, HCT116R, HCT15, and HCT15R cells. F) Dose responses of survival fractions of HCT116 and HCT15 cells with or without Erastin treatment after IR. G) Bright field images of PDOs treated with Erastin or 8Gy IR. Scale bar, 200 µm. H. Pattern plots of PDOX treated with Erastin or not that were irradiated at 8Gy*3d and then executed at the appropriate time. I) Tumor volume of Erastin, IR, and Erastin+IR groups was examined every 3 days until 9 days after IR. J) General view of tumor mass of each indicated group at 9 days after IR. * P < 0.05, ** P < 0.01,*** P < 0.001.
Figure 4
Figure 4
FOXP4 regulated ferroptosis in CRC. A) Scatter diagrams showed the correlation between FOXP4 and GPX4 in organoids and cell lines. B) Western blot assay of FOXP4, 4HNE, GPX4, β‐actin and α‐tubulin proteins in HCT116 and HCT15 cells transfected with shNC or shFOXP4. C) Representative images of ROS in HCT116 and HCT15 cells transfected with shNC or shFOXP4 at 4h after 4Gy IR. Nuclei were stained with Hoechst (×40). Scale bars, 10 µm. D) Representative images of liperfluo (a lipid peroxide fluorescent probe) in HCT116 and HCT15 cells transfected with shNC or shFOXP4 at 4h after 4Gy IR. Nuclei were stained with Hoechst (×40). Scale bars, 10 µm. E) Representative IHC images (x20) of FOXP4, 4HNE and GPX4 protein expression of nude mice xenograft tumors. Scale bar, 100 µm. * P < 0.05, ** P < 0.01 and *** P < 0.001.
Figure 5
Figure 5
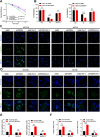
FOXP4 induced radioresistance by blocking ferroptosis in CRC cells. A) Dose responses of survival factions of HCT116‐shFOXP4 and HCT15‐shFOXP4 cells treated with Fer‐1. B. CCK‐8 assay measured cell viability of HCT116 and HCT15 cells at 48h after 4Gy IR or Fer‐1 treatment. C,E) Representative images (×40, C) and quantification (E) of liperfluo in HCT116 and HCT15 cells transfected with shNC or shFOXP4 and treated with Fer‐1 simultaneously at 4h after 4Gy IR. Nuclei were stained with Hoechst (×40). Scale bars, 10 µm. D–F) Representative images (×40, D) and quantification (F) of the relative fluorescence intensity of ROS in HCT116 and HCT15 cells transfected with shNC or shFOXP4 and treated with Fer‐1 simultaneously at 4h after 4Gy IR. Nuclei were stained with Hoechst (×40). Scale bars, 10 µm. * P < 0.05, ** P < 0.01,*** P < 0.001.
Figure 6
Figure 6
FOXP4 promoted GPX4 transcription in a dimerized form. A) Levels of GPX4 bound at the TSS of peaks in HCT116 and HCT15 cells in CUT&Tag‐seq analysis. Transcription start site, TSS. B. Cartoon diagram showed structures of FOXP4 (WT, FH‐Del and LZ‐Mut), GPX4‐Luc and GPX4‐MUT‐Luc. C) Dual‐luciferase reporter assay showed relative luciferase expression after knockdown of FOXP4 in HCT15 and HCT116 cells. n = 3. D–E) Quantification data (D) and agarose gel images (E) of ChIP PCR in HCT116 and HCT15 cells with FOXP4 knockdown. n = 3. F) Agarose gel images of ChIP PCR in HCT116 and HCT15 cells with overexpression of FOXP4‐WT or FOXP4‐FD‐Del. G) Cartoon diagram showed structures of FOXP1, FOXP2, and FOXP4. H) Cartoon diagram of FOXP4 dimerization with FOXP1, FOXP2 and FOXP4 by AlphaFold 2. I) Co‐IP assay of FOXP1 or FOXP2 and FOXP4‐WT or FOXP4‐LZ‐Mut in the whole cell lysates of HCT116 and HCT15 cells. J) EMSA measured the interaction between probes compassing the GPX4 motif and different protein (FOXP4‐WT with FOXP1, FOXP2 or FOXP4‐LZ‐Mut).* P < 0.05, ** P < 0.01, *** P < 0.001.
Figure 7
Figure 7
DOX enhanced radiosensitivity of CRC by promoting the ubiquitination of FOXP4. A) Cartoon illustration showed the interaction between DOX and FOXP4. B) Representative images and quantification of western blot assay of FOXP4 and α‐tubulin proteins in HCT15 cells treated with DOX. C) Dose responses of survival factions of HCT116 and HCT15 cells treated with or without DOX. D. Bright field image and quantitative results of PDOs treated with DOX after 8Gy irradiation. Scale bar, 200 µm. E) Pattern plots of PDOX treated with DOX that were irradiated at 8Gy*3d and then executed at the appropriate time. F) PDOX tumor volume of DOX, IR and DOX+IR groups was examined every 3 days until 9 days after IR(8Gy*3d). G) General view of tumor mass of each indicated group at 9 days after IR(8Gy*3d). H,I) Point‐fold line chart (H) of FOXP4 protein degradation according to western blot assay (I) showed the expression of FOXP4 protein at different time points after 4 Gy IR in HCT15 cells with or without DOX after CHX treatment. J) Western blot analysis of FOXP4 and α‐tubulin proteins in HCT15 cells at 4 h after 4 Gy IR. MG‐132 (10µM) or CQ (50µM) was added before IR. K) Anti‐Ub immunoblotting assay of FOXP4 polyubiquitination in HCT15 cells at 4h after 4Gy. * P < 0.05, ** P < 0.01, *** P < 0.001.

References

    1. Bray F., Laversanne M., Sung H., Ferlay J., Siegel R. L., Soerjomataram I., Jemal A., CA Cancer J. Clin. 2024, 74, 229. - PubMed
    1. Sauer R., Becker H., Hohenberger W., Rödel C., Wittekind C., Fietkau R., Martus P., Tschmelitsch J., Hager E., Hess C. F., Karstens J. H., Liersch T., Schmidberger H., Raab R., N. Engl. J. Med. 2004, 351, 1731. - PubMed
    1. van Gijn W., Marijnen C. A., Nagtegaal I. D., Kranenbarg E. M., Putter H., Wiggers T., Rutten H. J., Påhlman L., Glimelius B., van de Velde C. J., Lancet Oncol. 2011, 12, 575. - PubMed
    1. Zhu J., Liu A., Sun X., Liu L., Zhu Y., Zhang T., Jia J., Tan S., Wu J., Wang X., Zhou J., Yang J., Zhang C., Zhang H., Zhao Y., Cai G., Zhang W., Xia F., Wan J., Zhang H., Shen L., Cai S., Zhang Z., J. Clin. Oncol. 2020, 38, 4231. - PMC - PubMed
    1. Chen Q., Zheng W., Guan J., Liu H., Dan Y., Zhu L., Song Y., Zhou Y., Zhao X., Zhang Y., Bai Y., Pan Y., Zhang J., Shao C., Cell Death Differ. 2023, 30, 137. - PMC - PubMed

MeSH terms

Substances

LinkOut - more resources