. 2025 Aug 11;13(8):e010465.
doi: 10.1136/jitc-2024-010465.

Temporal optimization of CD25-biased IL-2 agonists and immune checkpoint blockade leads to synergistic anticancer activity despite robust regulatory T cell expansion

Affiliations

Temporal optimization of CD25-biased IL-2 agonists and immune checkpoint blockade leads to synergistic anticancer activity despite robust regulatory T cell expansion

Irfan Baki Kilic et al. J Immunother Cancer. .

Abstract

Background: Interleukin-2 (IL-2) immunotherapy can induce durable tumor remissions, but its clinical performance has been limited by significant drawbacks such as short serum half-life and high toxicity. Administration of IL-2 in complex with certain anti-IL-2 antibodies (IL-2cx) enhances circulation half-life while also selectivity directing the cytokine to particular immune cell subsets. In particular, IL-2cx has been developed that targets either cells expressing the CD25-containing high-affinity IL-2 receptor (ie, CD25-biased IL-2cx) or cells expressing the CD25-lacking intermediate-affinity IL-2 receptor (ie, CD25-blocking IL-2cx). Since regulatory T (Treg) cells primarily express the high-affinity IL-2 receptor whereas naïve effector T and natural killer cells mainly express the low-affinity IL-2 receptor, CD25-blocking IL-2cx have traditionally been considered as potential cancer therapeutics, particularly in combination with immune checkpoint inhibitors (ICIs).

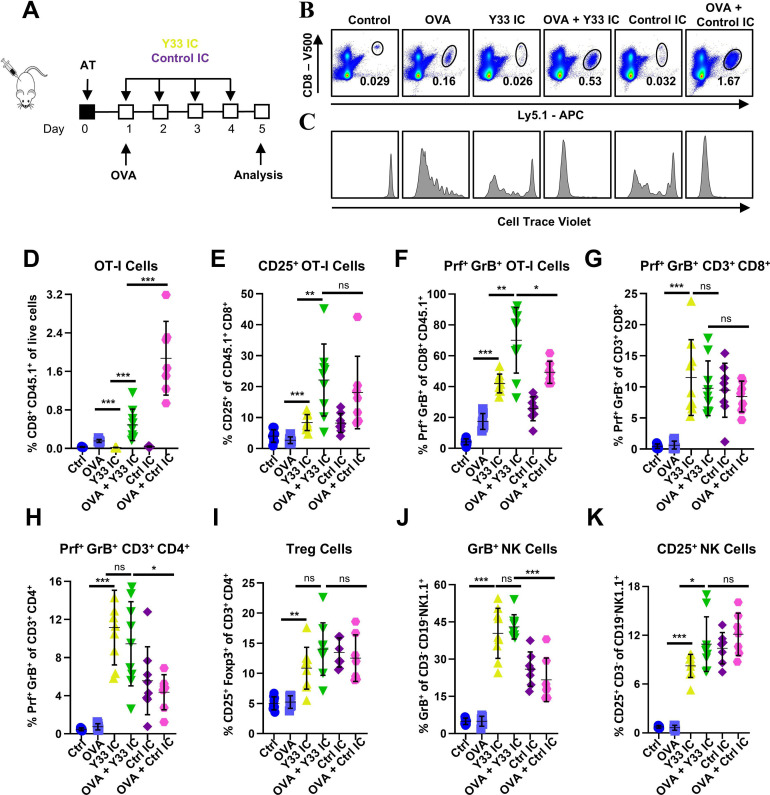
Methods: Stimulation of antigen-primed T cells by IL-2cx in the absence or presence of ICIs was evaluated through adoptive transfer of primed ovalbumin-specific T cells and analysis of expansion. Effects of IL-2cx on Treg cell-mediated inhibition of CD8+ T cells were assessed by flow cytometry and thymidine incorporation. Tumor-bearing mice received combination treatments comprizing IL-2cx and ICIs, where complexes were delivered either before or after ICIs. Tumor growth and mouse survival were monitored, and immune cell phenotyping was performed. Toxicity was determined by tracking body weight, temperature, and lung edema. Substitution of IL-2cx with single-agent cytokine/antibody fusion proteins (immunocytokines, ICs) was also explored.

Results: We showed that CD25-biased IL-2cx and ICs synergize with ICIs to completely eradicate large, established tumors despite robust Treg cell expansion. Importantly, we found that timing is crucial, as administration of IL-2cx after (but not before) ICIs led to profound antitumor effects. Mechanistically, CD25-biased IL-2cx selectively stimulated expansion and effector functions of tumor-specific CD8+ T cells in a CD25-dependent manner, overcoming Treg cell-mediated suppression. Moreover, CD25-biased IL-2cx showed much lower toxicity than CD25-blocking IL-2cx, enabling a larger therapeutic window. Furthermore, we demonstrated that administration of a human IL-2-based IC significantly enhanced the antitumor activity of ICIs, establishing the translational relevance of our work.

Conclusions: Our findings support the temporally optimized use of CD25-biased IL-2-based therapeutics in combination with ICIs for cancer immunotherapy.

Keywords: Cytokine; Immune Checkpoint Inhibitor; Immunotherapy; T cell; T regulatory cell - Treg.


Conflict of interest statement

Competing interests: JS and MK are listed as co-inventors on a patent entitled “Methods and materials for targeted expansion of immune effector cells”, which bears International Application Number PCT/US2020/039857. DV and JS are listed as co-inventors on a patent entitled “Methods and materials for targeted expansion of regulatory T cells”, which bears International Application Number PCT/US2020/039854. All other authors have no competing interests to disclose.

Figures

Figure 1
Figure 1. IL-2/JES6 potently and selectively expand antigen-primed CD8+ T cells. (A–C) Purified CD8+ or CD4+ T cells from OT-I or OT-II/RAG1−/−/Ly5.1 mice, respectively, were adoptively transferred (AT) into B6 mice. Mice were i.p. injected with 350 µg OVA, ICIs (αCTLA-4 + αPD-1 antibodies; 0.5 mg/kg each) and IL-2cx (2 µg IL-2/dose) and their spleens were analyzed by flow cytometry. A schematic of the study is shown (A), as is expansion of AT CD8+ (B) and CD4+ T (C) cells with depicted average±SD for all experimental groups. Each point represents an individual mouse. Data pooled from two to three independent experiments with n=6–12. (D), Purified CTV-labeled CD8+ OT-I cells were AT into B6 mice. Treatment was as depicted in (A), except the mice were not injected with OVA. Expansion of CD8+ T cells with depicted average±SD for all experimental groups. Each point represents an individual mouse. Data pooled from two independent experiments with n=6–8. (E-H), Proliferation of naive CD8+ (E, F) and CD4+ (G, H) T cells incubated in αCD3 antibody-coated wells with titrated concentrations of IL-2 or IL-2cx and αCD25 antibody (F, H) was determined by [3H]-thymidine incorporation. Data shown as average cpm from triplicates±SD. Experiment was conducted twice with comparable results. Results were statistically analyzed using an unpaired t-test for the highest concentration (ns: non-significant; *p<0.05; ***p<0.001). (I), Purified CTV-labeled CD8+ OT-I cells were AT into B6 mice. Treatment was as depicted in (A) except the mice were not injected with ICIs but i.p. with αCD25 antibody (200 µg/dose) on days 1 and 3. Expansion of CD8+ T cells with depicted average±SD for all experimental groups is shown. Each point represents an individual mouse. Data pooled from two independent experiments with n=6–8. Results were statistically analyzed by unpaired t-test (ns: non-significant; *p<0.05; ***p<0.001). αCTLA-4, anti-cytotoxic T-lymphocyte-associated antigen 4; αPD-1, anti-programmed cell death 1; cpm, counts per minute; CTV, CellTrace Violet; ICIs, immune checkpoint inhibitors; IL-2, interleukin-2; IL-2cx, anti-IL-2 antibodies; i.p., intraperitoneally; OVA, ovalbumin; PBS, phosphate-buffered saline.
Figure 2
Figure 2. IL-2/JES6 overcomes Treg cell-mediated suppression of CD8+ T cells. (A–C) CTV-labeled CD8+ T cells were cocultivated with Treg cells at the indicated ratios in αCD3 antibody-coated wells alone, with IL-2, or with IL-2/JES6 (10 ng IL-2/mL) for 72 hours. Overlay plots of CTV and CD25 expression for a CD8+:Treg cell ratio 1:1 versus CD8+ T cells only are shown (A), as is relative content of undivided CD8+ T cells in each experimental condition±SD (B) and average MFI of CD25 in CD8+ T cells±SD (C). (D–E) CD8+ T cells were cocultivated with Treg cells at the indicated ratios in αCD3 antibody-coated wells alone, with IL-2, or with IL-2/JES6 (10 ng IL-2/mL) for 72 hours. Proliferation of CD8+ T cells was determined by [3H]-thymidine incorporation, with data depicted as average cpm±SD for cells incubated in the absence of IL-2 (D) or with IL-2 or IL-2/JES6 (E). Experiments were performed three times with similar results. (F-G), Purified CD8+ from OT-I/RAG1−/−/Ly5.1 mice were adoptively transferred (AT) into B6 mice. Mice were i.p. injected with 350 µg OVA, αCD4 antibody (200 µg/dose) and IL-2/JES6 (8 µg IL-2/dose) and their spleens were analyzed by flow cytometry. A schematic of the study is shown (F), as is expansion of AT CD8+ T cells with depicted average±SD for all experimental groups (G). Each point represents an individual mouse. Data pooled from two independent experiments with n=7. Results were statistically analyzed by unpaired t-test (*p<0.05; ***p<0.001). (H) CTV-labeled CD8+ T cells were co-cultured with Treg cells at a 1:1 ratio in αCD3 antibody-coated wells, either alone or in the presence of titrated concentrations of IL-2 or IL-2/JES6 (0.01–100 ng IL-2/mL; red and blue) for 72 hours. Overlay plots depict CTV dilution (indicative of cell proliferation) and CD25 expression; cpm, counts per minute; CTV, CellTrace Violet; IL-2, interleukin-2; i.p., intraperitoneally; MFI, mean fluorescence intensity; OVA, ovalbumin; PBS, phosphate-buffered saline; Tregs, regulatory T cells.
Figure 3
Figure 3. IL-2/JES6 strongly potentiates the antitumor activity of ICIs when administered subsequently. (A–K) BALB/c mice were s.c. inoculated with 2×10⁵ CT26 cells on day 0. Mice were i.p. injected with ICIs (αCTLA-4 + αPD-1 antibodies; 0.5 mg/kg each per dose), IL-2cx (2 µg IL-2/dose), or both. Control mice were i.p. injected with the same volume (250 µL) of PBS. A schematic of the study is shown (A). IL-2cx was administered on days 4, 5, and 6 (IL-2cx Early) (B, C) or on days 14, 15, and 16 (IL-2cx Late) (D, E). Alternatively, IL-2cx was administered before treatment with ICIs (F, G) or after treatment with ICIs (H, I) or within the treatment with ICIs on days 7, 8 and 9 (J, K). Tumor growth (B, D, F, H, J) and survival of mice (C, E, G, I, K) were monitored. Data were pooled from two independent experiments with n=16 for each experimental group except for J and K, which showed one experiment with n=10. Each experimental point represents average±SD. Tumor growth was analyzed by one-way ANOVA, followed by Dunnett’s post hoc test. Survival was analyzed by the Mantle-Cox log-rank test (*p<0.05; **p<0.01; ***p<0.001). Median survival (MS) is shown for each experimental group, except in cases where the proportion of long-term surviving (LTS) mice exceeded 50%. αCTLA-4, anti-cytotoxic T-lymphocyte-associated antigen 4; ANOVA, analysis of variance; αPD-1, anti-programmed cell death 1; ICIs, immune checkpoint inhibitors; IL-2, interleukin-2; IL-2cx, anti-IL-2 antibodies; i.p., intraperitoneally; PBS, phosphate-buffered saline; s.c., subcutaneously.
Figure 4
Figure 4. Combination of ICIs with high-dose IL-2/JES6 leads to powerful antitumor activity. (A–F) BALB/c mice were s.c. inoculated with 2×10⁵ CT26 cells on day 0. Mice were i.p. injected with ICIs (αCTLA-4 + αPD-1 antibodies; 0.5 mg/kg each per dose), IL-2/JES6 (8 µg IL-2/dose), or both. Control mice were i.p. injected with the same volume (250 µL) of PBS. A schematic of the study is shown (A). Tumor growth (B) and survival of mice (C) were monitored. Data were pooled from two independent experiments with n=16 for each experimental group. (D–E), BALB/c mice were inoculated with CT26 cells and treated with ICIs and IL-2/JES6 as in (A). Mice were euthanized on day 19. Peripheral blood cells were stained with SPSYVYHQF/H-2Ld-APC or PE tetramer and analyzed by flow cytometry. Tetramer positive cells (%) in CD8+ T cells from one representative mouse (D) and with depicted average±SD for all experimental groups (E) are presented. FMO: fluorescence minus one control (no tetramer stain). Data were pooled from three independent experiments with n=18–20 for each experimental group. Results were statistically analyzed by unpaired t-test (*p<0.05; **p<0.01; ***p<0.001) (F), CD3ε−/− mice were s.c. inoculated with 1×10⁶ MC38/OVA on day 0. Purified CD8+ T cells from OT-I /RAG1−/−/Ly5.1 mice were adoptively transferred into these mice on day 5. IL-2/JES6 (4 µg IL-2/dose) was i.p. injected on days 6, 7, and 8, and tumor growth was monitored. The experiment was performed twice with comparable results (n=5–6). Each experimental point represents average±SD. Tumor growth was analyzed by one-way ANOVA, followed by Dunnett’s post hoc test. Survival was analyzed by the Mantle-Cox log-rank test (*p<0.05; **p<0.01; ***p<0.001). Median survival (MS) is shown for each experimental group, except in cases where the proportion of long-term surviving (LTS) mice exceeded 50%. αCTLA-4, anti-cytotoxic T-lymphocyte-associated antigen 4; ANOVA, analysis of variance; αPD-1, anti-programmed cell death 1; ICIs, immune checkpoint inhibitors; IL-2, interleukin-2; i.p., intraperitoneally; MHC, major histocompatibility complex; OVA, ovalbumin; PBS, phosphate-buffered saline; s.c., subcutaneously; SSC-A, side scatter-area.
Figure 5
Figure 5. CD25-biased single-chain fusion protein Y33 IC potentiates the antitumor activity of ICIs. (A–E) BALB/c mice were s.c. inoculated with 2×10⁵ CT26 cells on day 0. Mice were i.p. injected with ICIs (αCTLA-4 + αPD-1 antibodies; 0.5 mg/kg each per dose), hIL-2-based ICs (2 µg IL-2/dose), or combined ICIs+IC therapies. Control mice were i.p. injected with the same volume (250 µL) of PBS. A schematic of the study is shown (A) Tumor growth (B, C) and survival of mice (D, E) were monitored. Data are shown from one to two independent experiments with n=8 for tumor growth, and data were pooled from two independent experiments with n=16 for survival. Each experimental point represents average±SD. Tumor growth was analyzed by one-way ANOVA, followed by Dunnett’s post hoc test. Survival was analyzed by the Mantle-Cox log-rank test (*p<0.05; **p<0.01; ***p<0.001). Median survival (MS) is shown for each experimental group, except in cases where the proportion of long-term surviving (LTS) mice exceeded 50%. αCTLA-4, anti-cytotoxic T-lymphocyte-associated antigen 4; ANOVA, analysis of variance; αPD-1, anti-programmed cell death 1; ICIs, immune checkpoint inhibitors; i.p., intraperitoneally; s.c., subcutaneously.
Figure 6
Figure 6. Combining the Y33 IC with ICIs leads to robust activation of effector T cell immunity in CT26 tumor-bearing mice. (A–M) BALB/c mice were s.c. inoculated with 2×10⁵ CT26 cells on day 0. Mice were i.p. injected with ICIs (αCTLA-4 + αPD-1 antibodies; 0.5 mg/kg each per dose), hIL-2-based ICs (2 µg IL-2/dose), or combined ICIs+IC therapies. Control mice were i.p. injected with the same volume (250 µL) of PBS. A schematic of the study is shown (A). Flow cytometry analysis of various lymphocyte populations in the spleen (B–E) and in the tumor (F–M) was performed on day 21. Average±SD for each experimental group is shown. Each point represents an individual mouse. Data were pooled from two independent experiments with n=6–9 for each experimental group. Activated CD8+ T cells gated as CD3+CD8+CD25+Foxp3 cells; activated CD4+ Tconv cells gated as CD3+CD4+CD25+Foxp3 cells. Results were statistically analyzed by unpaired t-test (*p<0.05; **p<0.01; ***p<0.001). αCTLA-4, anti-cytotoxic T-lymphocyte-associated antigen 4; αPD-1, anti-programmed cell death 1; ICs, immunocytokines; ICIs, immune checkpoint inhibitors; i.p., intraperitoneally; NK, natural killer; ns, not significant; PBS, phosphate-buffered saline; s.c., subcutaneously; Tconv, conventional T cells; Tregs, regulatory T cells.
Figure 7
Figure 7. Y33 IC expands antigen-primed CD8+ T cells and significantly boosts their expression of effector molecules. (A–K) Purified CD8+ T cells from OT-I/RAG1−/−/Ly5.1 mice were adoptively transferred (AT) into B6 mice. Mice were i.p. injected with 350 µg OVA, hIL-2-based ICs (2 µg IL-2/dose), or OVA+ICs, and their spleens were analyzed by flow cytometry. A schematic of the study is shown (A), as are dot plots showing the expansion of AT CD8+ T cells in one representative mouse (B) and their respective CTV profile (C). Flow cytometry analysis of various lymphocyte populations in the spleen is presented (D–K). Average±SD for each experimental group is shown. Each point represents an individual mouse. Data were pooled from two independent experiments with n=6–9 for each experimental group. Results were statistically analyzed by unpaired t-test (*p<0.05; **p<0.01; ***p<0.001). CTV, CellTrace Violet; IC, immunocytokine; i.p., intraperitoneally; NK, natural killer; ns, not significant; OVA, ovalbumin; Treg, regulatory T cell.

Similar articles

References

    1. Boyman O, Sprent J. The role of interleukin-2 during homeostasis and activation of the immune system. Nat Rev Immunol. 2012;12:180–90. doi: 10.1038/nri3156. - DOI - PubMed
    1. Arenas-Ramirez N, Woytschak J, Boyman O. Interleukin-2: Biology, Design and Application. Trends Immunol. 2015;36:763–77. doi: 10.1016/j.it.2015.10.003. - DOI - PubMed
    1. Liao W, Lin JX, Leonard WJ. Interleukin-2 at the crossroads of effector responses, tolerance, and immunotherapy. Immunity. 2013;38:13–25. doi: 10.1016/j.immuni.2013.01.004. - DOI - PMC - PubMed
    1. Höfer T, Krichevsky O, Altan-Bonnet G. Competition for IL-2 between Regulatory and Effector T Cells to Chisel Immune Responses. Front Immunol. 2012;3:268. doi: 10.3389/fimmu.2012.00268. - DOI - PMC - PubMed
    1. Rosenberg SA, Yang JC, Topalian SL, et al. Treatment of 283 consecutive patients with metastatic melanoma or renal cell cancer using high-dose bolus interleukin 2. JAMA. 1994;271:907–13. - PubMed

MeSH terms

Substances

LinkOut - more resources