. 2025 Aug 11;16(1):7420.
doi: 10.1038/s41467-025-62871-y.

Future heat-related mortality in Europe driven by compound day-night heatwaves and demographic shifts

Affiliations

Future heat-related mortality in Europe driven by compound day-night heatwaves and demographic shifts

Xilin Wu et al. Nat Commun. .

Abstract

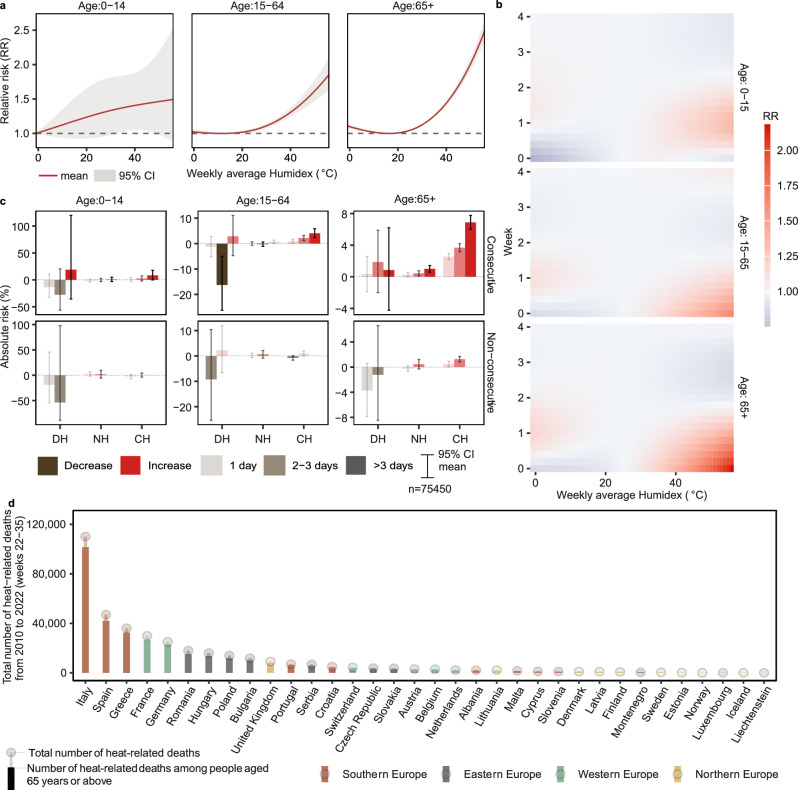
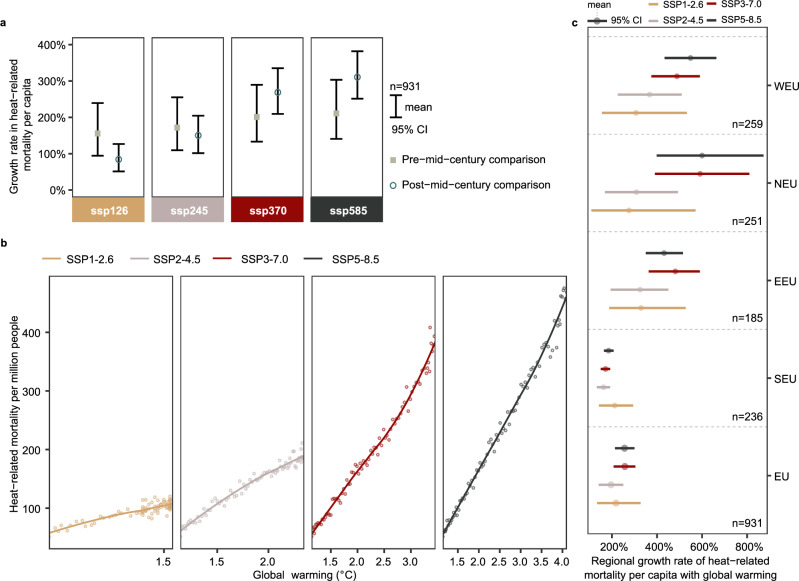
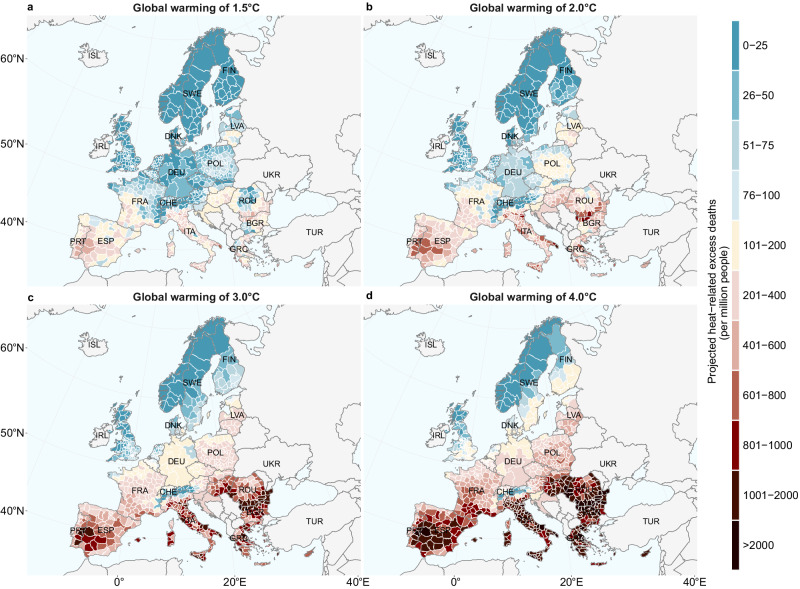
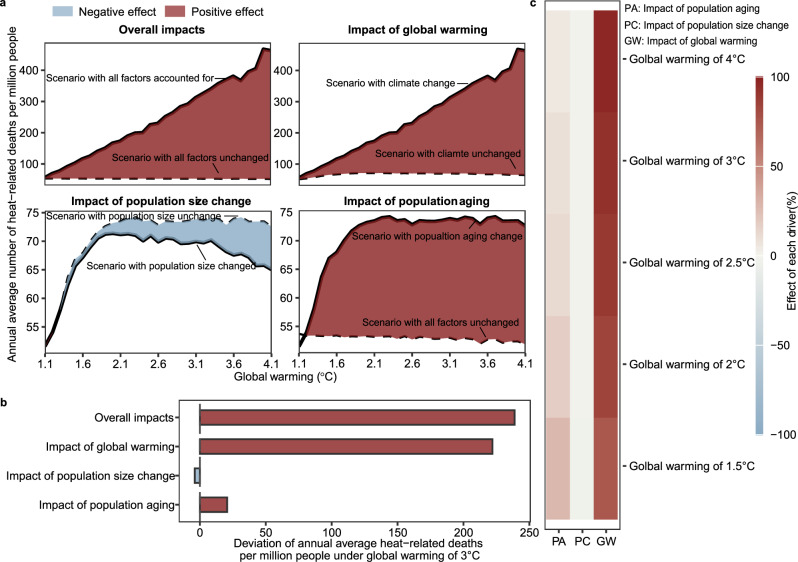
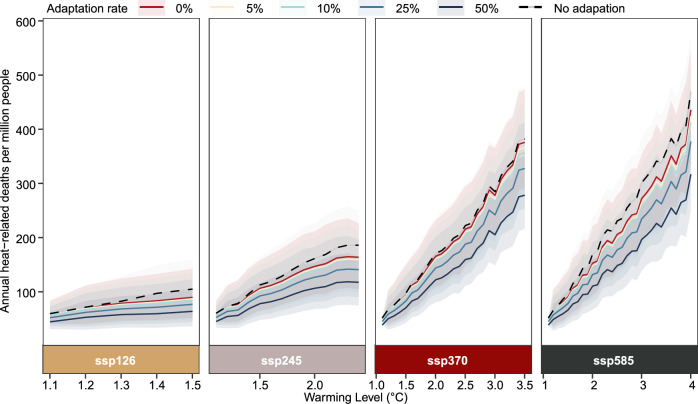
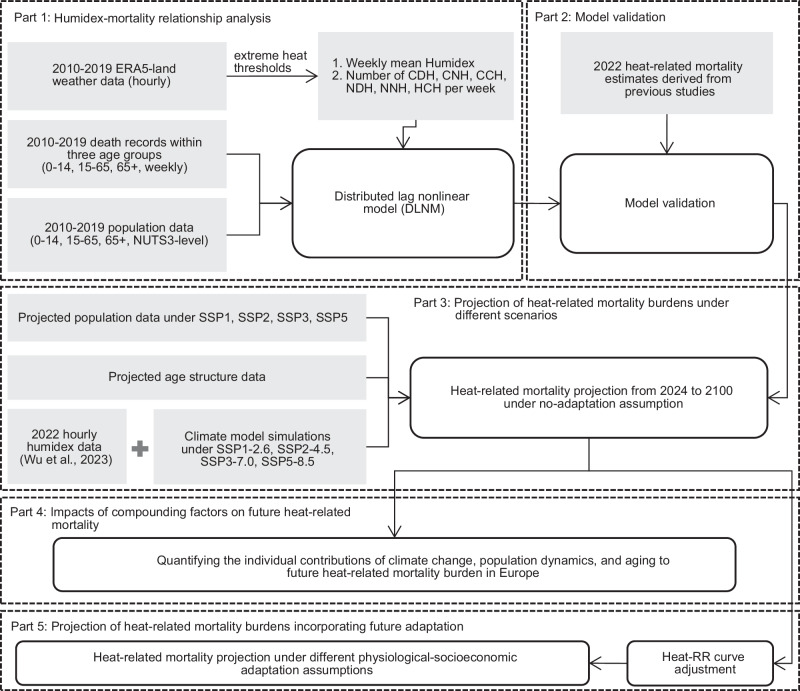
Anthropogenic climate change is driving summer heat toward more humid conditions, accompanied by more frequent day-night compound heat extremes (high temperatures during both day and night). As the fast-warming and aging continent, Europe faces escalating heat-related health risks. Here, we projected future heat-related mortality in Europe using a distributed lag nonlinear model that incorporates humid heat and compound heat extremes, strengthened by a health risk-based definition of extreme heat and a scenario matrix integrating time-varying adaptation trajectories. Under 2010-2019 adaptation baselines, future heat-related mortality is projected to increase annually by 103.7-135.1 deaths per million people by 2100 across various population-climate scenarios for every degree of global warming, with Western and Eastern Europe suffering the most. If global warming exceeds 2 °C, climate change will dominate (84.0-96.8%) projected increase in heat-related mortality. Across all socioeconomic pathways, even a 50% reduction in heat-related relative risk through physiological adaptation will be insufficient to offset the climate change-driven escalation of future heat-related mortality.


Conflict of interest statement

Competing interests: The authors declare no competing interests.

Figures

Fig. 1
Fig. 1. Heat–mortality associations and heat-related deaths in Europe.
a Cumulative relative risk–weekly Humidex response curves for three age groups: children (0–14 years), working-age population (15–64 years) and elderly (>65 years). Shown for each age group are the cumulative relative risk of death (lines) with a corresponding 95% confidence interval (shadings). b Heatmap illustrating the lagged effects of heat exposure on mortality. Red indicates an increased mortality risk (RR > 1), while blue indicates a decreased mortality risk (RR < 1). c Bar chart displaying variations in mortality risk with the duration of heat exposure. Each bar represents the absolute mortality risk of compound daytime-nighttime heat extremes (CH) relative to daytime-only heat extremes (DH). Absolute risk refers to the increased mortality risk during hot days compared to normal days. d Estimated total heat-related mortality across 34 European countries during summers (weeks 22–35) of 2010–2022. These nations are geographically divided into four regions (Northern, Southern, Eastern and Western Europe) based on the United Nations Geoscheme. Dark grey bars denote heat-related excess deaths in the elderly group, and light grey bars denote those in the all-age population.
Fig. 2
Fig. 2. Projected changes in heat-related mortality in Europe.
a Growth rate of heat-related excess mortality per capita under different population-climate scenarios. Squares and circles indicate comparisons for the near-mid-century and mid-end-century periods, respectively. The pre-mid-21st century growth rate is calculated by comparing mean mortality per capita between 2045–2055 and 2025–2030. The post-mid-21st century growth rate is calculated by comparing the mean mortality per capita between 2095–2100 and 2045–2055. Black bars represent the 95% confidence intervals of the projected growth rate of heat-related mortality per capita. b Variation in heat-related deaths per million people with global warming. Specific global warming levels are measured using the 20-year moving average of global mean surface temperature anomalies (relative to the 1850–1900 pre-industrial period). The years with the 20-year mean global warming magnitude exceeding the specific level are determined to calculate heat-related deaths per capita. c Regional growth rates of heat-related excess mortality per capita with global warming. Growth rates are represented by the linear slope of heat-related mortality against global warming levels—that is, the percentage change in additional heat-related mortality per capita per degree of global warming. These percentage changes are estimated relative to the 2022 baseline of 53.8 heat-related deaths per million people. Europe (EU) is divided into four regions: Northern (NEU), Western (WEU), Eastern (EEU) and Southern Europe (SEU), with baseline heat-related excess deaths of 5.46, 19.3, 48.4 and 145.0 per million people, respectively. Note that the 2022 baselines reported here differ from those in the previous section due to the exclusion of regions with missing data in projections.
Fig. 3
Fig. 3. Geographical distributions of projected heat-related excess mortality under different global warming levels.
The heat-related excess mortality is the projected annual average heat-related excess deaths per million population at a 1.5 °C, b 2.0 °C, c 3.0 °C, and (d) 4.0 °C. Results are based on the SSP5-8.5 population-climate scenario. Additional projections for alternative scenarios (SSP1-2.6, SSP2-4.5, and SSP3-7.0) are provided in Supplementary Figs. 10–12. Regions with missing data are shaded grey.
Fig. 4
Fig. 4. The relative contributions of climate change, population size changes, and population aging to future heat-related excess deaths per million people in Europe.
a Variations in the individual effects of climate change, population size changes and population aging, along with their total effects (overall impacts) on future heat-related excess deaths in Europe as global warming intensifies. Solid lines represent projected annual average heat-related excess deaths when all factors or a specific factor are accounted for, while dashed lines denote projections with all factors held constant. b Annual average number of heat-related excess deaths attributable to changes in climate, population size and age structure under a 3.0 °C global warming level. Additional projections for alternative warming scenarios (1.5 °C, 2.0 °C, 2.5 °C, and 4.0 °C) are provided in Supplementary Figs. 13–16. c Heatmap displaying the relative contributions of climate change, population size changes, and population aging under global warming levels of 1.5 °C, 2.0 °C, 2.5 °C, 3.0 °C and 4.0 °C. The relative contribution of each factor is determined by comparing the annual average number of heat-related deaths per million people attributable to that specific factor versus the total from all factors.
Fig. 5
Fig. 5. Projections of annual heat-related deaths per million people in Europe.
Dashed lines denote projections for the baseline no-adaptation scenario. Solid lines represent projections for five adaptation scenarios: zero-adaptation (0% reduction in excess relative risk), low adaptation (5% reduction), moderate adaptation (10% reduction), medium adaptation (25% reduction), and high adaptation (50% reduction). Note that the baseline no-adaptation and zero-adaptation scenarios represent distinct future states. The zero-adaptation scenario assumes no physiological heat adaptation but incorporates socioeconomic heat adaptation. In contrast, the baseline no-adaptation scenario assumes that future relative risk remains at the current level.
Fig. 6
Fig. 6. Schematic flowchart illustrating the data and models used in this study.
Here, CDH, CNH, CCH, NDH, NNH, and NCH denote consecutive daytime-only heat extreme, consecutive nighttime-only heat extreme, consecutive day-night compound heat extreme, non-consecutive daytime-only heat extreme, non-consecutive nighttime-only heat extreme, and non-consecutive day-night compound heat extreme, respectively. The regression model is trained using Humidex and mortality data during the summers (weeks 22–35) of 2010–2019. To minimize the confounding effects of the COVID-19 pandemic on mortality, data from 2020 to 2021 are excluded from both the model training and validation processes.

Similar articles

References

    1. Iyakaremye, V. et al. Increased high-temperature extremes and associated population exposure in Africa by the mid-21st century. Sci. Total Environ.790, 148162 (2021). - PubMed
    1. Fischer, E. M. & Knutti, R. Anthropogenic contribution to global occurrence of heavy-precipitation and high-temperature extremes. Nat. Clim. Chang5, 560–564 (2015).
    1. Chen, K. et al. Impact of population aging on future temperature-related mortality at different global warming levels. Nat. Commun.15, 1796 (2024). - PMC - PubMed
    1. Russo, S., Sillmann, J. & Sterl, A. Humid heat waves at different warming levels. Sci. Rep.7, 7477 (2017). - PMC - PubMed
    1. Rogers, C. D. W. et al. Recent increases in exposure to extreme humid-heat events disproportionately affect populated regions. Geophys. Res. Lett.48, e2021GL094183 (2021).

LinkOut - more resources