. 2025 Aug 12;15(1):29447.
doi: 10.1038/s41598-025-13608-w.

Dichloroacetate enhances Chemo-sensitivity in wild-type P53 breast cancer cells by modulating ABCG2 and NKG2DL

Affiliations

Dichloroacetate enhances Chemo-sensitivity in wild-type P53 breast cancer cells by modulating ABCG2 and NKG2DL

Sana Belkahla. Sci Rep. .

Abstract

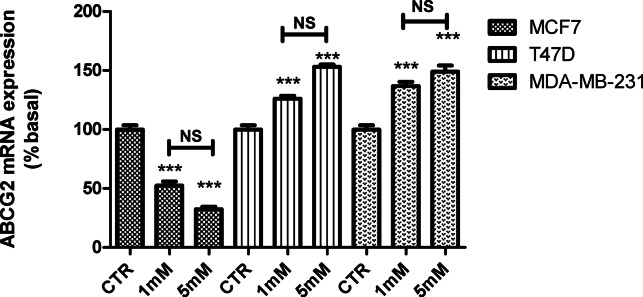
The chemotherapy drug called Adriamycin, often known as doxorubicin (Dox), is used to treat BC, including late stages. However, the emergence of resistance may reduce the efficacy of Dox in the treatment of BC. The objective of the current work is to assess how the stress ligands MICA, MICB, and ULBP1 and the expression of ABCG2 are affected by dichloroacetate (DCA). To determine the chemosensitivity of breast cancer cells, an MTT assay was performed. P-53 and ERK5 genes were silenced by Si-RNA, and gene expression level was monitored by qRT-PCR and confirmed by immunoblotting. When compared to untreated cells, our data show a significant decrease in the viability of all cell lines following a 24-hour incubation period with 5 µM of Dox in conjunction with 1 or 5 mM of DCA. The cell line MCF7 exhibited the highest rate of inhibition, followed by MDA-MB-231 and T47D. In addition, we found that DCA significantly decreases the level of ABCG2 mRNA in MCF7 cells. However, this effect was reversed in T47D and MDA-MB-231 cells. The expression of NKG2DL, MICA/B, and ULBP has also been studied. The findings indicate that DCA significantly increases the mRNA of MICA/B and ULBP1 exclusively in cells that express normal p53. ABCG2 mRNA expression is markedly upregulated in MCF7 cells upon P53 and ERK5 downregulation. Collectively, these findings showed that DCA increases the susceptibility of breast cancer cells to Dox through the upregulation of NKG2DL and the downregulation of ABCG2 expression via a p53-ERK5 dependent pathway.

Keywords: ABCG2; And chemoresistance; Breast cancer; Dichloroacetate; Doxorubicin; MICA/B; UBLP1.


Conflict of interest statement

Declarations. Competing interests: The authors declare no competing interests. Ethical statement: The author declares no conflict of interest exists.

Figures

Fig. 1
Fig. 1
Effect of DOX and DCA combination on cell death. MCF7, T47D and MDA-MB231 were cultured into 24-well plates at approximately 105 cells/well incubated until complete confluence than treated with 1, and 5 mM of DCA in combination with 5µM of Dox for 24 h. Cell death was monitored using MTT assay. Values were presented as percentage of mean of inhibition rate ± SEM of triplicates of four separate determinations. ANOVA and Bonferroni’s correction test were performed * P < 0.05 compared to control (Dox treated cells).
Fig. 2
Fig. 2
DCA modulates ABCG2 mRNA expression. MCF7, T47D and MDA-MB231 were cultured into 24-well plates at approximately 105 cells/well incubated until complete confluence than treated with 1, and 5 mM of DCA for 24 h. Total RNA was extracted and ABCG2 mRNA was quantified using Quantitative PCR. All samples were normalized to β-actin mRNA levels. Values were presented as percentage of mean of expression rate ± SEM of triplicates of three separate determinations. ANOVA and Tukey’s test were performed for multi-tests comparison * P < 0.05 compared to control (DCA non-treated cells).
Fig. 3
Fig. 3
(A) Effect of DCA on MICA mRNA expression level. MCF7, T47D and MDA-MB231 were cultured into 24-well plates at approximately 105 cells/well incubated until complete confluence than treated with 1, and 5 mM of DCA for 24 h. Total RNA was extracted and MICA mRNA was quantified using Quantitative PCR. All samples were normalized to β-actin mRNA levels. Values were presented as percentage of mean of expression rate P < 0.05 compared to control (DCA non-treated cells). (B) Effect of DCA on MICB mRNA expression level MCF7, T47D and MDA-MB231 were cultured into 24-well plates at approximately 105 cells/well incubated until complete confluence than treated with 1, and 5 mM of DCA for 24h. Total RNA was extracted and MICB mRNA was quantified using Quantitative PCR. All samples were normalized to β-actin mRNA levels. Values were presented as percentage of mean of expression rate ± SEM of triplicates of three separate determinations. ANOVA and Tukey’s test were performed for multi-tests comparison * P<0.05 compared to control (DCA non-treated cells). (C) MICA/B protein expression quantification MCF7, T47D and MDA-MB231 were cultured into 24-well plates at approximately 105 cells/well incubated until complete confluence than treated with 1, and 5 mM of DCA for 24h. MICA/B protein was quantified by blotting using antibody anti-MICA/B that recognize the two proteins. All samples were normalized to β-actin. Values were presented as percentage of mean of expression rate ± SEM of triplicates of three separate determinations. ANOVA and Tukey’s test were performed for multi-tests comparison * P<0.05 compared to control (DCA nopn-treated cells). (D) Effect of DCA on ULBP1 mRNA expression level MCF7, T47D and MDA-MB231 were cultured into 24-well plates at approximately 105 cells/well incubated until complete confluence than treated with 1, and 5 mM of DCA for 24h. Total RNA was extracted and ULBP1 mRNA was quantified using Quantitative PCR. All samples were normalized to β-actin mRNA levels. Values were presented as percentage of mean of expression rate ± SEM of triplicates of three separate determinations. ANOVA and Tukey’s test were performed for multi-tests comparison * P<0.05 compared to control (DCA non-treated cells). (E) ULBP1 protein expression quantification MCF7, T47D and MDA-MB231 were cultured into 24-well plates at approximately 105 cells/well incubated until complete confluence than treated with 1, and 5 mM of DCA for 24h. ULBP1 protein was quantified by blotting using antibody anti- ULBP1. All samples were normalized to β-actin. Values were presented as percentage of mean of expression rate ± SEM of triplicates of three separate determinations. * P<0.05 compared to control ANOVA and Tukey’s test were performed for multi-tests comparison (DCA non-treated cells)
Fig. 4
Fig. 4
ABCG2 and NKG2DL expressionrequires wt-P53. MCF7 cells were transfected with 100nM of si-P53 (Santa Cruz). For transfections, we used TRA-V-LIP-750 molequle-on as described by the manufacture and cultured for 48h. Total RNA was extracted and ABCG2, MICA, MICB, and ULBP1 mRNA was quantified using Quantitative PCR. All samples were normalized to β-actin mRNA levels. Western blots were performed as described in material and methods. Values were presented as percentage of mean of expression rate ± SEM of triplicates of four separate determinations. ANOVA and Tukey’s test were performed for multi-tests comparison * P<0.05 compared to control (scramble siRNA transfected cells).
Fig. 4
Fig. 4
ABCG2 and NKG2DL expressionrequires wt-P53. MCF7 cells were transfected with 100nM of si-P53 (Santa Cruz). For transfections, we used TRA-V-LIP-750 molequle-on as described by the manufacture and cultured for 48h. Total RNA was extracted and ABCG2, MICA, MICB, and ULBP1 mRNA was quantified using Quantitative PCR. All samples were normalized to β-actin mRNA levels. Western blots were performed as described in material and methods. Values were presented as percentage of mean of expression rate ± SEM of triplicates of four separate determinations. ANOVA and Tukey’s test were performed for multi-tests comparison * P<0.05 compared to control (scramble siRNA transfected cells).
Fig. 5
Fig. 5
ABCG2 mRNA expression is ERK5-dependent. MCF7 cell was maintained in DMEM containing 4.5 g/L glucose, 584 mg/L L-glutamine , sodium pyruvate, 10% FBS, 100U/mL penicillin and 100µg/mL streptomycin, and 2.5 µg/mL amphotericin B at the temperature of 37 °C in humidified 5% CO2 atmosphere. When cells reached 70 to 80% of confluence, they were transfected with 50nM of si-ERK5 (Santa Cruz). For transfections, we used TRA-V-LIP-750 molequle-on as described by the manufacture and cultured for 48h. Total RNA was extracted and ABCG2 mRNA was quantified using Quantitative PCR. All samples were normalized to β-actin mRNA levels. Values were presented as percentage of mean of expression rate ± SEM of triplicates of four separate determinations. ANOVA and Tukey’s test were performed for multi-tests comparison * P<0.05 compared to control (scramble siRNA transfected cells).

Similar articles

References

    1. World Health Organization Breast Cancer. https://www.who.int/cancer/prevention/diagnosis-screening/breast-cancer/en/ (2020).
    1. Maria, V. L. & Jason, W. L. The Warburg effect: how does it benefit cancer cells?? Trends Biochem. Sci.41 (3), 211–218 (2016). - PMC - PubMed
    1. Song, K. L., Xu, M., Xuan, L. I., Huang, G. & Liu, Q. Resistance to chemotherapy is associated with altered glucose metabolism in acute myeloid leukemia. Oncol. Lett.12, 334–342 (2016). - PMC - PubMed
    1. Zhou, Y. et al. Intracellular ATP levels are a pivotal determinant of chemoresistance in colon cancer cells. Cancer Res.72, 304–314 (2012). - PMC - PubMed
    1. Shimura, T. et al. AKT-mediated enhanced aerobic Glycolysis causes acquired radioresistance by human tumor cells. Radiother Oncol.112, 302–307 (2014). - PubMed

MeSH terms