. 2025 Sep;57(9):2313-2322.
doi: 10.1038/s41588-025-02246-7. Epub 2025 Aug 11.

Genetic variation at transcription factor binding sites largely explains phenotypic heritability in maize

Affiliations

Genetic variation at transcription factor binding sites largely explains phenotypic heritability in maize

Julia Engelhorn et al. Nat Genet. 2025 Sep.

Abstract

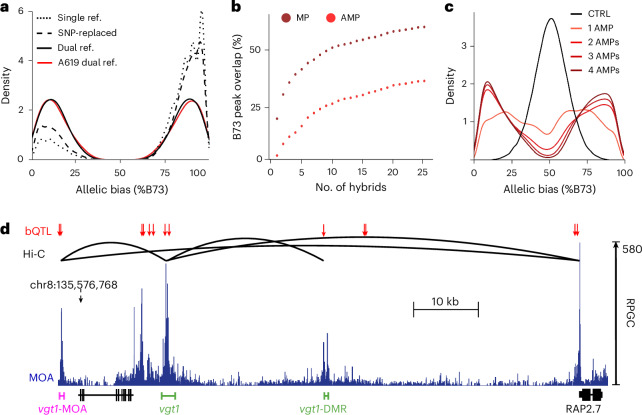
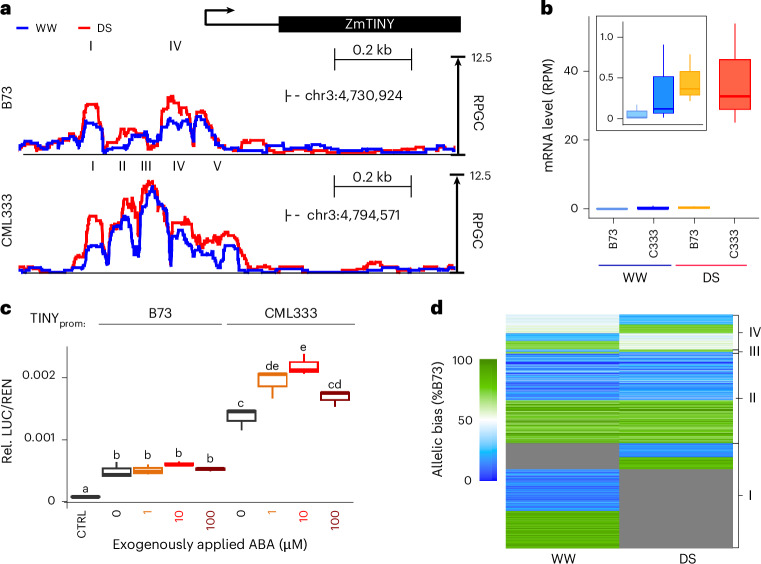
Comprehensive maps of functional variation at transcription factor (TF) binding sites (cis-elements) are crucial for elucidating how genotype shapes phenotype. Here, we report the construction of a pan-cistrome of the maize leaf under well-watered and drought conditions. We quantified haplotype-specific TF footprints across a pan-genome of 25 maize hybrids and mapped over 200,000 variants, genetic, epigenetic, or both (termed binding quantitative trait loci (bQTL)), linked to cis-element occupancy. Three lines of evidence support the functional significance of bQTL: (1) coincidence with causative loci that regulate traits, including vgt1, ZmTRE1 and the MITE transposon near ZmNAC111 under drought; (2) bQTL allelic bias is shared between inbred parents and matches chromatin immunoprecipitation sequencing results; and (3) partitioning genetic variation across genomic regions demonstrates that bQTL capture the majority of heritable trait variation across ~72% of 143 phenotypes. Our study provides an auspicious approach to make functional cis-variation accessible at scale for genetic studies and targeted engineering of complex traits.


Conflict of interest statement

Competing interests: The authors declare no competing interests.

Figures

Fig. 1
Fig. 1. Quantitative cis-element occupancy analysis in F1 hybrids.
a, Haplotype-specific MOA flowchart: 1) Nuclei purified from diverse nested (B73 common mother) F1s are analyzed by MOA-seq, producing small, non-nucleosomal, protein–DNA interaction footprints. 2) SNPs in MOA peaks (MPs) allow the identification, quantification and, in a population, association of variants coupled to occupancy of putative cis-elements. Allele-specific MOA footprints can be compared between treatments; for example, well-watered versus drought. 3) Allele-specific mRNA-seq allows further characterization of functional variants associated with gene regulation. Created with Biorender.comb, Correlation of haplotype-specific MOA-seq data at all MPs in nuclei from B73 versus Mo17 inbreds (x axis) versus those from the F1 (y axis) (Pearson correlation, 0.78). MPs with significant (red, P < 0.05, expected trans) and without significant (black, expected cis) differences between F1 and parental alleles are marked. c, Genome-wide comparison of allelic bias (50–60% to one allele considered no bias, >60% considered biased) at B73 × Mo17 F1 AMP sites to inbred B73 versus Mo17 data. Only sites that displayed binding in both inbreds and hybrids were considered. d, Genome-wide directionality analysis, comparing AMPs detected by MOA-seq to ChIP–seq data of a single TF BZR1 (ref. ) in the B73 × Mo17 hybrid. Only sites that displayed binding in both ChIP and hybrid MOA were considered. In c and d, MOA occupancy was largely consistent (red circle) between either F1 and parents or compared to ChIP–seq, respectively, in showing bias towards B73 (green) or Mo17 (blue) in both cases, with a smaller fraction of allele-specific F1 MOA sites showing no bias (gray) in inbreds or ChIP–seq, or bias to the opposite parent or allele (B73 in F1 and Mo17 in inbred or ChIP, purple or Mo17 in F1 and B73 in inbred or ChIP, yellow). Source data
Fig. 2
Fig. 2. Construction of a maize leaf pan-cistrome.
a, Mapping strategies comparison showing the density of AMPs (allele-specific occupied sites) over the percentage of binding to B73. B73 × HP301 F1 MOA data were analyzed using either only B73 as reference genome (single ref.), a pseudo-genome with B73/HP301 SNPs replaced by Ns (SNP-replaced) or our dual-parent mapping strategy using a concatenated B73 × HP301 genome (dual ref.). Without mapping bias, a symmetric distribution is expected (as observed for dual ref.), while a higher density at higher B73 allelic bias indicates biased mapping to the reference genome B73 (single ref. and SNP-replaced). For the A619 F1 (no assembled genome available), our ‘reference-guided’ strategy (see Methods for details) showed similar AMP-balanced haplotypes without reference bias (A619 dual ref.). b, Additive percent of B73 MOA peak covered by MPs (brown) and AMPs (red) relative to the number of F1s analyzed. c, Density of mean MOA binding frequencies over all F1s carrying a SNP at positions where at least one, two, three or four F1s had AMPs, compared to a control with randomized binding frequencies. d, Overview of bQTL (red arrows), MOA coverage (blue) and Hi-C interaction sites (black lines, Hi-C from a previous publication) near the classical flowering repressor RAP2.7. bQTL overlap with both known enhancers, vgt1 and vgt1-DMR (green), associated with RAP2.7 expression. An additional bQTL, termed vgt1-MOA (magenta), also interacts with vgt1 and the RAP2-7 promoter. Source data
Fig. 3
Fig. 3. bQTL correlate with haplotype-specific transcript variation.
a, Allelic distribution (%B73) of MOA reads at bQTL in either the TRE1 (Zm00001eb021270, bQTL: B73-chr1:80,826,022) or SUB11 (Zm00001eb152020, bQTL B73-chr3:198,733,446) proximal promoters (TRE1: 19 F1s with G/G and six F1s with G/C alleles; SUB11: eight F1s with C/C and 16 F1s with C/T alleles). b, Haplotype-specific mRNA counts for TRE1 and SUB11 grouped by their respective bQTL alleles in a (TRE1: nine F1s with G/G and six F1s carrying G/C alleles; SUB11: six F1s with C/C and 15 F1s with C/T alleles). Only lines with polymorphic alleles were considered. FC, fold change. c, Genes with ASE and non-ASE mRNA abundance are significantly more and less enriched for AMPs in their 3 kb upstream promoter, respectively (n = 24 F1s, hypergeometric test; Supplementary Table 7a–c). d, bQTL are more often in linkage disequilibrium with cis-expression QTL, identified in roots of 340 recombinant inbred lines than matched bgSNPs. e, Average, normalized MOA coverage for B73 and NAM alleles of B73 × Mo18W and B73 × CML69 upstream of PGM1, Zm00001eb196320. The Mo18W allele showed significantly higher MOA occupancy (green panel), while the CML69 allele showed similar MOA coverage to B73, yet peaks were shifted ~300 bp because of a MITE transposon (red triangle) insertion (purple panel). f, Allele-specific mRNA counts (n = 3 biological replicates) of PGM1 in the different F1 hybrids. Colors indicate MOA ratios at bQTL: NAM > B73 (green, >60% bias to NAM, non-B73 allele for at least one bQTL), B73 = NAM (yellow, %B73 occupancy between 40% and 60%, sharing B73 genotype) and transposon insertion haplotype (purple). All F1s within the NAM > B73 and transposon category displayed significantly higher or lower mRNA levels in the NAM allele compared to B73, respectively (detected by DESeq2; Methods), while none of the B73 = NAM category were significantly different. Boxplots in a, b, c and f denote the range from the first to the third quartile, lines within boxes indicate the median and whiskers represent 1.5-fold of the interquartile range. Source data
Fig. 4
Fig. 4. bQTL are linked to variation in DNA methylation.
a, Genome-wide overlap of differentially methylated (CG and/or CHG) DNA regions with MPs, AMPs and AMPs with strong (≥85%) allelic bias, across the 24 F1s. b, Correlation of differentially CG-methylated DNA with allelic bias for MPs in the 24 F1 hybrids. MP methylation categories: equally methylated (eqM), B73 hypermethylated versus NAM hypomethylated (B-hyper N-hypo) or B73 hypomethylated versus NAM hypermethylated (B-hypo N-hyper). c, Correlation between MOA footprint bias and differential methylation at loci that varied both in allele-specific footprint occupancy (≥1 F1s with AMP) and CG methylation (≥2 F1s with and without allele-specific methylation difference) between the 24 F1s. At each position, F1s were partitioned into those with either differential allelic CG methylation (red) or equal CG methylation (blue). Box and violin plots were drawn for the two categories, showing the distribution of percentages of F1s with haplotype-specific binding (AMPs). n = 24 F1s in a, b and c; boxplots were generated as in Fig. 3. Source data
Fig. 5
Fig. 5. A large fraction of heritability is explained by bQTL.
a, Association of ~42,000 curated GWAS hits (±100 bp) with bQTL (only those associated with genotype alone), or n = 100 bootstraps of matched bgSNPs (same bgSNP sets used as for VCAP; Methods) at distances ranging from intragenic to >20 kb to the nearest gene. b, Estimated additive genetic variance organized by 143 traits. Colored ridges show the estimated additive genetic variance across 100 permutations for either bQTL, bgSNPs or remaining genome SNPs. Black symbols represent the mean estimated value across permutations. Traits are arranged by bQTL mean variance estimates and color-coded according to general trait groupings: vitamin E metabolites, navy blue; metabolites, purple; stalk strength, light blue; flowering time, gold; plant architecture, red; disease, green; tassel architecture, pink; ear architecture, orange; miscellaneous, gray. c, A subset of traits (y axis) and their estimated percent additive genetic variance (x axis) shown as colored box plots instead of ridges. PH, plant height,; LeafL, leaf length; DTA, days to anthesis,; DTS, days to silking; SLB, southern leaf blight,; and delta-tocopherol concentration, vitamin E biosynthesis; n = 100 permutations. Boxplots in a and c were generated as described in Fig. 3; data outside the whisker range are considered outliers. Source data
Fig. 6
Fig. 6. Characterization of a drought-responsive cistrome.
a,b, Morphological phenotypes of the more tolerant B73 × Oh43 (a) and susceptible B73 × Mo18W (b) F1s grown under WW and DS conditions. Scale bars, 10 cm. c, Allelic distribution of MOA read coverage at bQTL (B73-chr1:198,205,029) in the ZmSO promoter. The six F1s sharing the B73 allele (C/C) were compared to 17 F1s carrying C/A alleles. d, Haplotype-specific mRNA counts, normalized to the B73 WW allele, grouped by the ZmSO bQTL alleles shown in c. Haplotype-specific read counts (reads per million (RPM), also adjusted for differences in SNP counts between F1s) relative to the B73 allele WW level to allow count comparisons between F1s (n = 21 F1s with gene polymorphism to permit haplotype-specific analysis, 5 C/C and 16 C/A alleles). e, Allelic distribution of MOA reads at a bQTL (B73-chr2:28,118,442) in the ZmTIP3d promoter. The 12 F1s sharing the B73 allele (C/C) were compared to 13 F1s carrying C/G alleles. f, Haplotype-specific mRNA abundance grouped by the ZmTIP3d bQTL alleles shown in e. RPM values per haplotype are normalized to the B73 DS mRNA level (n = 23 F1s that permitted haplotype-specific MOA/RNA analysis: DS, 10 C/C, 13 C/G; WW: 5 C/C, 5 C/G). n.d., not detected. Boxplots in c, d, e and f were generated as described in Fig. 3. Source data
Fig. 7
Fig. 7. MOA-seq detects drought-responsive cis-regulatory loci.
a, Average (three biological replicates), normalized MOA coverage for B73 × CML333 near ZmTINY under WW and DS conditions. Roman numerals highlight respective DS-peak regions identified (P < 0.05, MACS3) in each line. b, Haplotype-specific mRNA counts of ZmTINY for B73 × CML333 (C333) under WW and DS conditions (three biological replicates). The zoomed-in square highlights (left to right) WW-B73, WW-CML333 and DS-B73. c, Relative luciferase levels in maize leaf protoplasts harboring either ~0.5 kb of the B73 or CML333 proximal promoter allele upstream of the ZmTINY TSS, with and without 1–100 µM ABA treatment. Letters represent significant differences (P < 0.05, ANOVA with Tukey test; Source data). d, Heatmap of MOA allelic bias at AMP loci under WW and DS conditions. AMPs (under WW, DS or both) in drought-responsive MOA peaks (P < 0.05; Methods) are displayed for B73 × Oh43. Color scale ranging from green (100% bias towards B73) to blue (100% bias towards Oh43); gray represents MOA signal below the detection limit (MACS3; Methods). Clusters represent (I) allele-specific occupancy in one condition and below detection limit in the other, (II) allele-specific occupancy with consistent bias under both conditions, (III) allele-specific occupancy with bias in the opposite direction under the two conditions and (IV) occupancy with a significant allele-specific bias under only one condition. Only sites with significant allele-specific bias (binomial testing, FDR, 1%; for details see Methods) in at least one condition were considered. To avoid additional statistical cut-off effects for the second condition, 60% or more occupancy bias towards one allele was considered allele-specific. Boxplots in b and d were generated as described in Fig. 3. Source data
Extended Data Fig. 1
Extended Data Fig. 1. Examples of allele-specific B73xMo17 MOA-seq and comparison to allele-specific ChIP-seq.
a) Average, normalized, allele-specific ChIP-seq of the ZmBZR1 TF (top two rows, black) and MOA-seq (bottom two rows, B73 green, Mo17 blue; fragment center data, see methods) shown upstream of ZmPGIP2. c) Average, normalized, allele-specific differences in MOA coverage upstream of ZmBIF2 overlap with a known, ‘hypervariable’ (Hv, purple box) cis-regulatory region. b, d) Normalized, average MOA coverage of three biological replicas at orange dashed boxes in a (P = 0.015, two-sided t-test) and c (P = 0.003, two-sided t-test). RPGC = number of reads per 1 bp / scaling factor (total number of mapped reads multiplied by fragment length / effective genome size). Boxes in plots denote the range from the first to the third quartile, and lines within boxes indicate the median. Whiskers represent 1.5-fold of the interquartile range. Source data
Extended Data Fig. 2
Extended Data Fig. 2. Correlation of methylation differences between the alleles in the B73xMo17 hybrid and the respective inbred parents and additional MOA-seq variation explained by methylation.
a and b) Methylation differences at AMP loci are expressed as Mo17 methylation values subtracted from B73 methylation values in inbred and hybrid comparisons (a: CG, b: CHG). Blue line indicates x = y for orientation. PCC: Pearson Correlation Coefficient. c and d) Numbers of clumbed bQTL (SNP approach c, INDEL approach d) in WW conditions that display either a significant correlation of MOA-seq signal and the genotype (Genotype only), of MOA-seq signal and the methylation status within +/− 20 bp of the position (Meth. only) or both. Source data
Extended Data Fig. 3
Extended Data Fig. 3. Distributions of bQTL, GWAS hits, and selective sweep genomic features across ten maize chromosomes.
From inner to outer circle, the tracks are: 1. chromosome names; 2. XP-CLR scores of selective sweeps detected between modern maize and teosinte, 3. -log10 p-values of the maize GWAS Atlas lead SNPs; and 4. -log10 p-values of bQTL (SNP and INDEL) associated with variation in MOA coverage in the pan-cistrome. Red markers denote selected examples of bQTL that coincide with natural variation of classical domestication and flowering time genes. Source data
Extended Data Fig. 4
Extended Data Fig. 4. Assessment of relative water content of the 25 F1 hybrids under well-watered and drought conditions.
* indicate significant difference between WW and DS based on ANOVA followed by Tukey HSD test, p < 0.01 (exact p-values provided in source data). n = 9 pots with 4 plants each. Source data
Extended Data Fig. 5
Extended Data Fig. 5. Overview of the ZmTINY locus with allele-specific mRNA abundance and TF-binding.
a) Genome browser view of the upstream and downstream region of ZmTINY in the hybrid of B73xCML333. Green arrows mark DS-bQTL positions. Yellow blocks mark regions analyzed in (c). The black transposable elements (TE) block marks a TE that is present in B73, A188, Ki3, and Mo18W. The scale bar applies to both tracks. b) Fold change (FC) in mRNA abundance between the NAM allele and the B73 allele under DS conditions. c) FC in MOA occupancy between the NAM allele and the B73 allele under DS conditions. Average MOA occupancy per base was calculated in the three yellow regions marked in (a). To ensure comparison of homologous regions, regions between two homologous SNPs determined by whole-genome alignment were chosen. Note that the W22 promoter contains a TE in the (A) region, adding ~5 kb compared to the syntenic W22 region. Two additional regions in W22 were compared to the B73 (A) region: the region up to the TE (FC 0.36) and a region of similar length to the B73 (A) region (FC 0.21). The downstream regions of A188 and Mo18W do not differ from B73, and thus, no FC could be detected. d: CG methylation in 40 bp surrounding SNP B73-chr3:4729798 (just after the TE sequence downstream of ZmTINY). Source data

References

    1. Chia, J.-M. et al. Maize HapMap2 identifies extant variation from a genome in flux. Nat. Genet.44, 803–807 (2012). - PubMed
    1. Rodgers-Melnick, E., Vera, D. L., Bass, H. W. & Buckler, E. S. Open chromatin reveals the functional maize genome. Proc. Natl Acad. Sci. USA113, E3177–E3184 (2016). - PMC - PubMed
    1. Lorant, A., Ross-Ibarra, J. & Tenaillon, M. Genomics of long- and short-term adaptation in maize and teosintes. in Statistical Population Genomics (ed. Dutheil, J. Y.) 289–311 (Springer, 2020). 10.1007/978-1-0716-0199-0_12 - PubMed
    1. Song, B. et al. Conserved noncoding sequences provide insights into regulatory sequence and loss of gene expression in maize. Genome Res.7, 1245–1257 (2021). - PMC - PubMed
    1. Marand, A. P., Eveland, A. L., Kaufmann, K. & Springer, N. M. Cis-regulatory elements in plant development, adaptation, and evolution. Annu. Rev. Plant Biol.74, 111–137 (2023). - PMC - PubMed

LinkOut - more resources