. 2025 Sep;27(9):1422-1430.
doi: 10.1038/s41556-025-01730-w. Epub 2025 Aug 11.

A multichaperone condensate enhances protein folding in the endoplasmic reticulum

Affiliations

A multichaperone condensate enhances protein folding in the endoplasmic reticulum

Anna Leder et al. Nat Cell Biol. 2025 Sep.

Abstract

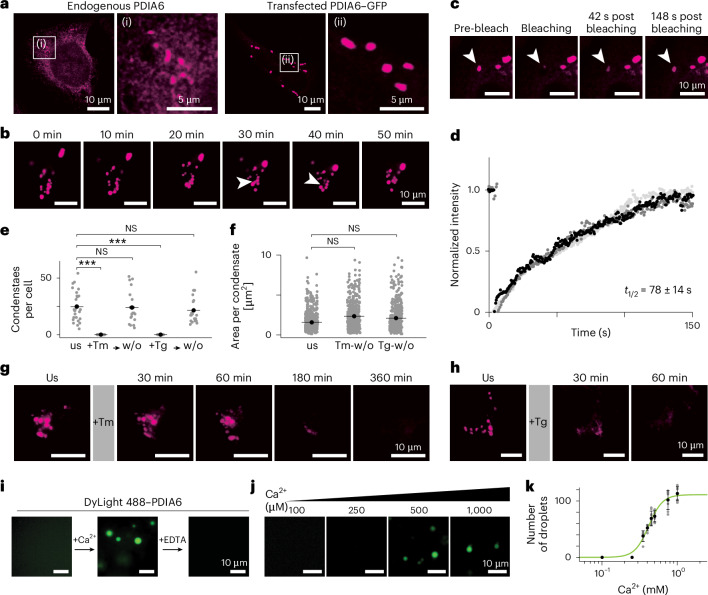
Protein folding in the endoplasmic reticulum (ER) relies on a network of molecular chaperones that facilitates the folding and maturation of client proteins. How the ER chaperones organize in a supramolecular manner to exert their cooperativity has, however, remained unclear. Here we report the discovery of a multichaperone condensate in the ER lumen, which is formed around the chaperone PDIA6 during protein folding homeostasis. The condensates form in a Ca2+-dependent manner and we resolve the underlying mechanism at the atomic and cellular levels. The PDIA6 condensates recruit further chaperones-Hsp70 BiP, J-domain protein ERdj3, disulfide isomerase PDIA1 and Hsp90 Grp94-which constitute some of the essential components of the early folding machinery. The chaperone condensates enhance folding of proteins, such as proinsulin, and prevent protein misfolding in the ER lumen. The PDIA6-scaffolded chaperone condensates hence provide the functional basis for spatial and temporal coordination of the dynamic ER chaperone network.


Conflict of interest statement

Competing interests: The authors declare no competing interests.

Figures

Fig. 1
Fig. 1. PDIA6 forms phase-separated condensates that dissolve in response to ER stress.
a, Fixed HeLa cells expressing endogenous PDIA6 (left) and live-cell images of HeLa cells transfected with PDIA6–GFP (right). Endogenous PDIA6 was stained with anti-PDIA6 and overexpressed PDIA6–GFP was visualized by imaging eGFP. b, Time series of a HeLa cell transiently transfected with PDIA6–GFP. A fusion event is indicated by arrowheads. c, PDIA6–GFP FRAP experiment in HeLa cells. d, Fluorescence recovery analysis of the PDIA6–GFP FRAP experiment presented in c. In vivo analysis of three cells from three independent experiments each coloured in a different shade of grey. The black trace corresponds to Supplementary Video 3. e, Number of condensates in unstressed cells as well as cells subjected to tunicamycin or thapsigargin treatment and subsequent washouts. A total of 622, 0, 449, 0 and 455 condensates were observed in n = 25, 24, 21, 25 and 20 cells, respectively, from left to right, pooled from three independent biological replicates. P = 2.33 × 10−10, P = 0.337, P = 9.65 × 10−11 and P = 0.785 (left to right); two-sided unpaired Mann–Whitney test. Tg, thapsigargin stress; Tm, tunicamycin stress; us, unstressed; w/o, washout. f, Condensate size in unstressed and recovered cells after treatment with tunicamycin or thapsigargin; n = 25, 21 and 20 cells, respectively, pooled from three independent biological replicates. P = 0.226 (left) and P = 0.464 (right); two-sided unpaired Mann–Whitney test. g,h, Time series images of individual HeLa cells transiently transfected with PDIA6–GFP during tunicamycin (g) and thapsigargin (h) treatment. i, In vitro phase separation of DyLight 488–PDIA6 in the presence of crowding agent (left), crowding agent plus 10 mM Ca2+ (middle) and crowding agent plus 10 mM Ca2+ and 20 mM EDTA (right). j, In vitro phase separation of DyLight 488–PDIA6 in the presence of crowding agent with different concentrations of Ca2+, as indicated. k, Number of in vitro PDIA6 droplets per field of view in the presence of crowding agent at different Ca2+ concentrations and fitted Hill equation binding model (green slope). Data are the mean ± s.d.; n = 9 images for [Ca2+] ≥ 500 μM and n = 6 images for [Ca2+] < 500 μM per condition, pooled from three independent experiments. All images are representative of at least three independent experiments. ***P < 0.001; NS, not significant. Source data
Fig. 2
Fig. 2. Structural characterization of PDIA6.
a, Domain organization of PDIA6 including the cleaved signalling sequence (dashed), delimitations for domains a0, a and b, and the C-terminal tail (t). b, Two-dimensional strips of a three-dimensional 13C, 13C-resolved [1H, 1H]-NOESY spectrum of 1 mM PDIA6. The proton frequency is shown in the top-left corner of each strip. Intramolecular (grey) and intermolecular (pink) NOEs are indicated. c, Crystal structure of PDIA6 domain a0 (PDB: 4ef0) with subunits coloured in pink and grey. The NOE network detected in b is indicated by dashed blue lines. d, Interface between domain a (light grey) and b (dark grey). Proline residues in the linker are highlighted in gold. The interdomain NOE contact between L266 in domain a and M331 in domain b is represented by a blue line. e, Section of the two-dimensional [13C,1H]-heteronuclear multiple quantum correlation (HMQC) spectrum of 100 μM methyl-labelled PDIA6. Signals of residues in the tail are highlighted in blue. f, Structural model of dimeric PDIA6 full-length (PDB: a0, 4ef0; a, 4gwr; b, 8cpq). g, Paramagnetic relaxation enhancement effect of 0.5 equivalent (eq.) Gd3+ on methyl groups of 100 μM methyl-labelled PDIA6 WT (top) and outcompetition by Ca2+ (bottom). Residues with substantial loss in intensity are highlighted in shades of purple. h, Structural model of PDIA6 domain a (light grey) and b (dark grey) representing the methyl groups identified in g. i, Ca2+ binding sites I (left) and II (right). Ca2+ ions are modelled based on calsequestrin (PDB: 5kn3; Extended Data Fig. 6d,e). Methyl groups with substantial loss in intensity in g are represented as spheres. Side chains of Ca2+ binding residues are shown as sticks.
Fig. 3
Fig. 3. Mechanism of PDIA6 liquid–liquid phase separation condensate formation.
a, Composition of the linker connecting domains a0 and a. b, Sections of a two-dimensional [13C,1H]-HMQC spectrum of PDIA6 WT in the presence of 10 mM Ca2+ (left) and with the addition of 10 eq. linker peptide (right) without crowding agent. The two peak sets of conformations P and O are shown on the example of residues V301 and M367. c, Relative populations of PDIA6 conformations P (dark blue) and O (light blue), in the presence of 10 mM Ca2+ and 10 eq. linker peptide (blue spheres) or following the addition of 1 M KCl. d, Relative populations of PDIA6 conformations P (dark blue) and O (light blue), as indicated. In c and d, data are the mean ± s.d. of n = 9 non-overlapping methyl group residues in domain b. NMR spectra are presented in Supplementary Fig. 1. e, In vitro phase separation of DyLight 488–PDIA6 constructs, as indicated, in the presence of crowding agent and 10 mM Ca2+. f, Live-cell images of HeLa cells transfected with PDIA6–GFP WT or linker mutants. In cf, blue spheres represent positively charged residues in the peptide linker, while white spheres represent neutralizing mutations. g,h, Model of the domain a0a0 dimerization interface (g) as well as the intermolecular interaction between the linker and domain b of two PDIA6 dimers (h). One dimer of PDIA6 is coloured in dark pink, the other in light pink. i, Model of PDIA6 droplet formation (details in text). Source data
Fig. 4
Fig. 4. Chaperones involved in early client processing are selectively recruited into PDIA6 condensates.
a, Co-localization of endogenous PDIA6 and BiP in fixed HeLa cells. Arrowheads exemplarily indicate the position of condensates. b, Co-localization of overexpressed PDIA6–GFP and endogenous BiP in fixed HeLa cells. Representative quantification from nine cells from three independent replicates. c, Co-localization of overexpressed PDIA6–GFP 5× linker mutant and endogenous BiP in fixed HeLa cells. PDIA6 was visualized using the eGFP signal. d, Docking model of PDIA6 and BiP, based on NMR data. Methyl groups with substantial chemical shift perturbation (CSP) upon interaction between PDIA6 and BiP are marked on the structures as coloured spheres. e, DyLight 633–BiP NBD in the presence of crowding agent and 10 mM Ca2+ (left), and co-localization with DyLight 488–PDIA6 (right) in vitro. f, Co-localization of endogenous BiP and ERdj3 (top), PDIA6 and PDIA1 (middle), and PDIA6 and Grp94 (blue) in fixed HeLa cells. Arrowheads exemplarily indicate the position of condensates. g, Co-localization of overexpressed PDIA6–GFP and endogenous calreticulin in fixed HeLa cells. In b and g, fluorescence intensities across the condensates were measured along the yellow line (left) and are shown as histograms (right). a.u., arbitrary units. h, Co-localization analysis of various ER chaperones and PDIA6 (or BiP). PCC for pixel intensity of proteins in HeLa cells as indicated. Transfected PDIA6–GFP WT is indicated with an asterisk; all other proteins are endogenous. Individual data points (PCC per cell; n = 10 for PDIA6*–ERdj3 and PDIA6*–calreticulin, 13 for PDIA6*–BiP and 15 for all other protein co-localizations), pooled from three independent experiments, and the s.d. are shown (details in Supplementary Table 2). Source data
Fig. 5
Fig. 5. Chaperone condensates function as folding factories.
a, Co-localization of endogenous PDIA6 and overexpressed proinsulin–myc in fixed HeLa cells. Arrowheads exemplarily indicate the position of condensates. b, Co-localization of overexpressed PDIA6–GFP and proinsulin–myc in fixed HeLa cells. c, Secretion levels of insulin (medium), and expression levels of PDIA6 and α-tubulin (lysate) in HeLa cells transfected with proinsulin, proinsulin + PDIA6–GFP WT or proinsulin + PDIA6–GFP 5× linker mutant. Proinsulin was not detectable in the lysate. d, Secretion levels of insulin (medium) as well as expression levels of PDIA6, proinsulin and α-tubulin (lysate) in INS-1 cells transfected with mock, PDIA6–GFP WT or PDIA6–GFP 5× linker mutant. In c and d, representative blots from three independent replicates. e, Fold increase in spliced XBP1 (sXBP1) in HeLa cells transfected with PDIA6 WT or 5× linker mutant relative to untransfected cells, determined using quantitative PCR with reverse transcription (P = 0.00092). f, Flow cytometry-based cell aggresome analysis of HeLa cells transfected with PDIA6–GFP WT or PDIA6–GFP 5× linker mutant, detected by PROTEOSTAT aggresome dye (P = 0.007). Gating strategy summarized in Supplementary Fig. 2. g, Half recovery time of mApple–Sec61 in HeLa cells co-transfected with PDIA6–GFP WT or PDIA6–GFP 5× linker mutant. Data from three independent experiments were fitted individually and averaged (P = 0.003). In eg, data are the mean ± s.d.; n = 3 independent biological experiments per condition; two-sided Student’s t-test. h, Model of PDIA6 chaperones condensates functioning as folding factories (details in text). **P < 0.01, ***P < 0.001. Unprocessed blots are available. Source data
Extended Data Fig. 1
Extended Data Fig. 1. In vivo phase separation of PDIA6.
a, Quantification of endogenous PDIA6 enrichment in condensates visualized by anti-PDIA6 antibody. Mean and standard deviation (n = 25 cells, pooled across three independent experiments). A total of 2,300 condensates were counted. b, PDIA6 was endogenously tagged with HaloTag in HeLa cells (PDIA6EN-Halo). Live-cell imaging of HeLa cells stably PDIA6EN-Halo fusion. PDIA6 was visualized by staining with the HaloTag ligand JFX-554. Scale bar, 20 μm, inset 5 μm. c, Quantification of PDIA6EN-Halo enrichment in condensates of live cells. PDIA6 was visualized by the HaloTag ligand JFX-554. Mean and standard deviation (n = 25 cells, pooled across three independent experiments). A total of 2,320 condensates were counted. d, Fixed HeLa cells stably expressing PDIA6EN-Halo fusion. PDIA6 stained with anti-HaloTag antibody. e, Quantification of PDIA6EN-Halo enrichment in condensates of fixed cell images. PDIA6 was stained by an α-Halo-antibody. Mean and standard deviation (n = 25 cells, pooled across three independent experiments). A total of 2,650 condensates were counted. f, Quantification of transiently transfected PDIA6–GFP enrichment in condensates visualized by the eGFP signal. Mean and standard deviation (n = 31 cells, pooled across three independent experiments). A total of 720 condensates were counted. g, Fixed HeLa cells transfected with PDIA6–GFP (eGFP signal) and stained against PDIA6 (anti-PDIA6 antibody, imaged in red channel) recorded at low (left) and high exposure (right). Scale bar, 20 μm. h, Fixed HeLa cells expressing endogenous PDIA6 (pink, left) and transfected with PDIA6–GFP (pink, right) stained for DAPI (blue). PDIA6–GFP was visualized by imaging eGFP. Scale bar, 20 μm, insert 5 μm. i, Live-cell imaging of HeLa cells transfected with PDIA6–GFP (pink), treated with ER tracker (red). The white arrows indicate the position of PDIA6 condensates. Scale bar, 20 μm, insert 5 μM. j, Fixed HEK293A cells expressing endogenous PDIA6 (left) and live-cell imaging of HEK293A cells transfected with PDIA6–GFP (right). Endogenous PDIA6 was stained with an anti-PDIA6 antibody, overexpressed PDIA6–GFP was visualized by imaging eGFP. Scale bar, 20 μm, insert 5 μm. k, Fixed U2OS cells expressing endogenous PDIA6 (left) and live-cell imaging of U2OS cells transfected with PDIA6–GFP (right). Endogenous PDIA6 was stained with an anti-PDIA6 antibody, overexpressed PDIA6–GFP was visualized by imaging eGFP. Scale bar, 20 μm, insert 5 μm. l, Time series of a single HeLa cell stably expressing PDIA6EN-Halo fusion. Scale bar, 20 μm, inset 5 μm. m, FRAP experiment of PDIA6EN-Halo. Images were not bleach-corrected n, Fluorescence recovery analysis of PDIA6EN-Halo FRAP experiment presented in m. Representative data of three independent replicates. Source data
Extended Data Fig. 2
Extended Data Fig. 2. Effect of ER stress on PDIA6 condensates.
a, Fixed HeLa cells co-transfected with PDIA6–GFP (pink) and Akita proinsulin-myc (green). Akita proinsulin, a folding-defective mutant of proinsulin, was used to mimic the accumulation unfolded/misfolded proteins in the ER lumen. Akita proinsulin forms puncta, as previously reported. PDIA6 was visualized by imaging eGFP, Akita proinsulin using an anti-myc antibody. Scale bar, 20 μm, insert 5 μm. b, Western blot showing expression levels of PDIA6, BiP and α-tubulin and at indicated time points of Tm treatment in HeLa cells. Unprocessed blots are available. Representative blot of three independent experiments. c, Quantification of PDIA6 and BiP levels from blot shown in b. Data representative of an experimental triplicate (n = 3). Mean and standard deviation. df, Fixed HeLa cells expressing endogenous PDIA6 and live-cell imaging of HeLa cells transfected with PDIA6–GFP after 10 h of Tm treatment (d), 10 h of Tg treatment (e) or 16 h of CPA (reversible Tg analogue) treatment (f) (left) and 24 h after drug washout (right). Endogenous PDIA6 was stained with an anti-PDIA6 antibody, overexpressed PDIA6–GFP was visualized by imaging eGFP. g, Fixed HeLa cells expressing endogenous PDIA6 observed at different time points after Tm (top) and Tg treatment (bottom). Source data
Extended Data Fig. 3
Extended Data Fig. 3. In vitro reconstitution of PDIA6 droplets.
a, In vitro phase separation of PDIA6 (left) and Dylight 488–PDIA6 (right) with 10 mM Ca2+ in absence (top) and presence (bottom) of 10% PEG3350. Scale bar, 10 μm. b, In vitro time evolution of Dylight 488–PDIA6 droplets in presence of 10 mM Ca2+. Scale bar, 10 μm. c, FRAP experiments of Dylight 488–PDIA6 in presence of 10 mM Ca2+. Scale bar, 2 μm. d, Fluorescence recovery analysis of the Dylight 488–PDIA6 FRAP experiments presented in c. Experimental triplicate in shades of grey. e, Fusion event of Dylight 488–PDIA6 in presence of crowding agent and 10 mM Ca2+. Scale bar, 5 μm. f, In vitro phase separation of unlabelled PDIA6 in presence of crowding agent in absence (left) and presence of 10 mM Ca2+ (middle), and in presence of 10 mM Ca2+ and 20 mM EDTA (right). Scale bar, 10 μm. g, In vitro phase separation of Dylight 488–PDIA6 at different concentrations in presence of crowding agent and different Ca2+ concentrations after 30 min (left) and after 5 min (right), as indicated. Scale bar, 10 μm. Source data
Extended Data Fig. 4
Extended Data Fig. 4. PDIA6 methyl group and amide backbone NMR assignments.
a, 2D [13C,1H]-HMQC spectrum of methyl-labelled PDIA6. Assignment of Met[13C1H]ε, Val-[13C1H]γ2 and Leu-[13C1H]δ2 methyl groups are indicated. Peaks annotated with a “t” correspond to residues in the C-terminal tail which could not be unambiguously assigned. b, Assigned methyl groups (pink spheres) displayed on the structure of PDIA6 established in Fig. 2. Blue spheres represent partially assigned residues in the C-terminal tail. ce, 2D [15N,1H]-HSQC spectra of PDIA6 domain a0 (c), domain a (d) and domain ab (e). Sequence-specific resonance assignments are indicated. f, Percentages of assigned residues of methyl and amide groups in PDIA6 FL and domain constructs.
Extended Data Fig. 5
Extended Data Fig. 5. Domain characterization of PDIA6.
a, SEC elution profiles (solid lines, left axis) and MALS apparent molecular mass (dotted lines, right axis) of PDIA6 full-length (FL) and domains. b, Sequence alignment of helix α4 of PDI catalytically active domains. The extended helix α4 of PDIA6 is highlighted by a pink square. Residues forming the leucine-valine adhesive dimerization motif are marked by an orange square. Domain delimitations as defined on uniport.org or by available crystal structures. c, Structural comparison of PDI catalytically active domains helix α4. d, Mass photometry of PDIA6 at 50 nM and 25 nM. Occupancy and oligomeric state are indicated for each peak. e, Crystal structure of PDIA6 domain b at a resolution of 1.8 Å. f, Zoom on the electron density map of PDIA6 domain b crystal structure. g, Potential of mean force along the collective variable (CV). The free energy profile for the WT protein (274PPP276) has one minimum at ΔCV 0 (black), while the 274GGG276 linker is flexible in the 0–2 Å range and the free energy increases slower with CV distance (yellow). h, Protein logo analysis of PDIA6 of domain a-b linker of Homo sapiens, Rattus norvegicus, Mus musculus, Pongo abelii, Drosophila melanogaster and Caenorhabditis elegans. i, Thermal stability of reduced domain a (light grey), domain b (dark grey) and domain ab (pink)as determined by differential scanning fluorimetry.
Extended Data Fig. 6
Extended Data Fig. 6. Localization of three Ca2+ binding sites in PDIA6.
a, Overlay of 2D [13C,1H]-HMQC spectra of 100 μM methyl-labelled PDIA6 in absence (black) and presence of 10 mM Ca2+ (purple). Full spectra shown in Supplementary Fig. 3a. b, Overlay of 2D [13C,1H]-HMQC spectra of 100 μM methyl-labelled PDIA6 in absence (black) and presence of 0.05 eq. Gd3+ (purple). Full spectra shown in Supplementary Fig. 3b. c, PRE-effect of 0.05 eq. Gd3+ on full-length PDIA6 (top) and truncated ΔC PDIA6 (middle) and outcompetition of 0.5 eq. Gd3+ by 1 mM Ca2+ on full-length PDIA6 (bottom). Residues with substantial loss in intensity are highlighted in shades of purple (I, II and III). d,e, Zoom on Ca2+ binding site of calsequestrin low Ca2+ form (PDB: 5kn3, yellow) (left) and overlay with PDIA6 (grey) Ca2+ binding sites I (d) and II (e) (right). Side chains of Ca2+ binding residues shown as sticks. Methyl groups with substantial loss in intensity in Fig. 2g represented as spheres as in Fig. 2h. The Ca2+ ions in calsequestrin are coordinated by the amino acid residues Asp/Glu/Asp for site I and Asn/Asn/Asp/Asp for site II, while in PDIA6 by Asp/Ser/Ser and Asn/Glu/Gln/Thr, respectively, resulting in weaker Ca2+ binding. f, Overlayed sections of 2D [15N,1H]-HSQC spectra of 100 μM PDIA6 domain ab in absence (black) and in presence of excess Ca2+ showing assigned residues located at Ca2+ binding sites. Full spectra in Supplementary Fig. 4. g, Soluble expression yields of PDIA6 constructs with mutations (S263A, D271L, E280M, N284K, T337V or Q342K) targeting the Ca2+ binding sites. h, Fixed HeLa cells transfected with PDIA6–GFP ΔC. Scale bar, 10 μm. i, In vitro phase separation of Dylight 488–PDIA6 EQDN, which has been reported to not bind Ca2+ at the C-terminal tail. Scale bar, 10 μm.
Extended Data Fig. 7
Extended Data Fig. 7. Specificity of PDIA6 phase separation in cells and in vitro.
a, Live-cell imaging of HeLa cells transfected with a monomeric mutant of PDIA6–GFP. Scale bar, 20 μm. b, In vitro phase separation of Dylight 488–PDIA6 subconstructs. The EQDN mutant has been described before to not bind Ca2+ to the C-terminal tail (binding site III). Scale bar, 10 μm c, Residue-specific populations of the conformation P (dark blue) and O (light blue). Each bar corresponds to one methyl group in domain b. d, Combined methyl chemical shift differences between conformations P and O in domain b. The significance threshold of 2 SDs is indicated by a pink line. e, Methyl groups with substantial chemical shift difference between conformations P and O marked as pink spheres on the structure of domain b. Residues located around helix α3 show largest chemical shift differences between the two conformations. f, Electrostatic surface potential (ESP) of domain b. Helix α3 forms part of a negatively charged patch. g, SEC elution profiles (solid lines, left axis) and MALS apparent molecular mass (dotted lines, right axis) of PDIA6 WT (pink), (R142Q, K150N, R153Q) (light blue), (K150N, R153Q, K159N) (dark blue) and 5x linker mutant (grey). All proteins eluted as a dimer. h, Melting temperature of PDIA6 WT and linker mutant constructs in SEC buffer and in presence of 10 mM of Ca2+ determined by DSF. Mean and standard deviation (n = 3 technical triplicates). Colour code as in g. i, Insulin reduction by PDIA6 WT and linker mutants. Dots represent the average and the line the fit of three independent measurements (left). Insulin reduction rate of the linker mutants relative to the WT protein (right). Colour code as in g. Mean and standard deviation (n = 3 technical triplicates). j, Chaperone activity of PDIA6 WT and linker mutants assessed by the aggregation of citrate synthase as a model substrate. Colour code as in g. Mean and standard deviation (n = 3 technical triplicates). k, Quantification of condensates per cell of PDIA6 WT (same data as in Fig. 1e unstressed (us), pink) and PDIA6 5x linker mutant (grey) transfected cells (***P = 1.14·10−7, two-sided t-test), (n = 17 cells per condition pooled across three independent experiments). l, Protein expression levels of endogenous PDIA6 and transfected PDIA6–GFP in HeLa cells. Unprocessed blots are available. m, In vitro phase separation of Dylight 488–PDIA6 WT + Dylight 488–PDIA6 5x linker mutant at 1:1 stoichiometry in presence of 10 mM Ca2+ at a final protein concentration of 25 μM (left) and 50 μM (middle) and 25 μM Dylight 488–PDIA6 WT for comparison (right). Scale bar, 10 μm. Source data
Extended Data Fig. 8
Extended Data Fig. 8. PDIA6 domain b recruits BiP into the condensates.
a, Quantification of enrichment of BiP in endogenous PDIA6 condensates (left, n = 25 cells, pooled across three independent experiments, a total of 2,300 condensates were counted) and in transiently transfected PDIA6–GFP condensates (right, n = 31 cells, pooled across three independent experiments, a total of 720 condensates were counted). Mean and standard deviation. b, Co-localization of overexpressed PDIA6–GFP (pink) and overexpressed BiP–mCherry (blue) in live HeLa cells (left) and of endogenous PDIA6 (pink) and overexpressed BiP–mCherry (blue) in fixed HeLa cells (right). PDIA6–GFP was visualized by imaging eGFP, BiP–mCherry by imaging mCherry. Scale bar, 20 μm, insert 5 μm. c, Co-localization of overexpressed PDIA6–GFP (pink) and endogenous BiP (blue) in fixed HeLa cells at low (left) and high (right) exposure. Scale bar, 10 μm. d, Overlay of 2D [13C,1H]-HMQC spectra of 100 μM PDIA6 in absence (black) and in presence of 2 eq. BiP (blue). Full spectra shown in Supplementary Fig. 5a. e, Overlay of 2D [15N,1H]-HSQC spectra of 100 μM PDIA6 domain ab in absence (black) and in presence of 2 eq. BiP (blue). Full spectra shown in Supplementary Fig. 5b. f, Combined methyl chemical shift perturbation of PDIA6 upon titration of 2 eq. BiP. The magnitudes of 1.5 SD and 2 SDs are indicated by pink lines. g, Combined amide chemical shift perturbation of PDIA6 domain ab upon titration of BiP. The magnitude of 1.5 SD is indicated by a purple line, disappearing residues in blue. h, Methyl groups with substantial CSP upon interaction with BiP shown as pink spheres on the structure of domain b. Amide groups with substantial CSP are shown as purple surface. i, Overlay of 2D [13C,1H]-HMQC spectra of 100 μM methyl-labelled BiP in absence (black) and in presence of 2 eq. PDIA6 (blue). Full spectra shown in Supplementary Fig. 6. j, Combined methyl chemical shift perturbation of BiP upon titration of 2 eq. PDIA6. The magnitudes of 2 SDs is indicated by a blue line. k, Methyl groups with substantial CSP upon interaction with PDIA6 shown as blue spheres on the structure of the undocked ADP-bound BiP (modelled on PDB: 2kho). l, Microscale thermophoresis signal of Dylight 488–PDIA6 plotted against BiP concentration in presence of 1 mM Ca2+. Mean and standard deviation (n = 3, technical triplicates). Source data
Extended Data Fig. 9
Extended Data Fig. 9. Composition of PDIA6 chaperone condensates.
a, Co-localization of overexpressed PDIA6–GFP (pink) and endogenous Grp94 (blue) (top), overexpressed PDIA6–GFP (pink) and endogenous ERdj3 (blue) (bottom) and overexpressed PDIA6–GFP (pink) and endogenous PDIA1 (blue) (right) in fixed HeLa cells. PDIA6 was visualized using the eGFP signal. Scale bar, 10 μm, insert 5 μm. b, Co-localization of overexpressed PDIA6–GFP (pink) and endogenous calnexin (blue) in fixed HeLa cells. PDIA6 was visualized using the eGFP signal. Scale bar, 10 μm, insert 5 μm. Fluorescence intensities across the condensates were measured along the yellow line and are shown as histograms (right). Representative quantification from 9 cells from three independent replicates. c, Co-localization of endogenous BiP (pink) and endogenous calreticulin (blue) (top) or calnexin (blue) (bottom) in fixed HeLa cells. Scale bar, 10 μm, insert 5 μm. Fluorescence intensities across the condensates were measured along the yellow line and are shown as histograms (right).
Extended Data Fig. 10
Extended Data Fig. 10. PDIA6-scaffolded chaperone condensates reduce ER protein aggregation.
a, Co-localization analysis by Pearson Correlation Coefficient (PCC) for pixel intensity of proinsulin and endogenous and overexpressed (*) PDIA6 in HeLa cells. Individual data points (PCC per cell) (n = 15/11 cells for PDIA6-proinsulin and PDIA6*-proinsulin respectively) pooled across three independent experiments and standard deviation (for details see Supplementary Table 2). b, Secretion levels of insulin (medium) and expression levels of proinsulin, PDIA6 and α-tubulin (lysate) in proinsulin, proinsulin + PDIA6–GFP WT or proinsulin + PDIA6–GFP 5x linker mutant transfected HeLa cells after 18 h treatment with the proteasome inhibitor MG-132. c, Live-cell imaging of INS-1 cells transfected with PDIA6–GFP WT (left) or PDIA6–GFP 5x linker mutant (right). PDIA6–GFP was visualized by imaging eGFP. Scale bar, 10 μm. d, Aggresomes detected by PROTEOSTAT dye (green) in fixed HeLa cells transfected with PDIA6–GFP WT (left) or PDIA6–GFP 5x linker mutant (right) (pink). Scale bar, 20 μm, insert 5 μm. e,f, FRAP experiments of mApple–Sec61 (grey) in HeLa cells, co-transfected with PDIA6–GFP WT (e) or PDIA6–GFP 5x linker mutant (f) (pink). Due to strong bleaching of the mApple, contrast and brightness were adjusted for each image individually. Scale bar, 20 μm, insets 5 μm. g, Fluorescence recovery curve of photobleached mApple–Sec61 in PDIA6–GFP WT (pink) or PDIA6–GFP 5x linker mutant (grey) co-transfected HeLa cells. Average and standard deviation of experimental triplicates. Bleached areas did not overlap with condensates. h,i, Cell viability of PDIA6–GFP WT (pink) and PDIA6–GFP 5x linker mutant (grey) transfected cells relative to mock-transfected cells by MTT. (***P = 0.0003, two-sided t-test) (n = 9, triplicates of three independent biological experiments; h) and trypan blue assay (***P = 0.0003, two-sided t-test) (n = 9, parallel triplicates from three independent biological experiments; i). For the trypan blue assay a total of 12,760 (PDIA6–GFP WT), 8,519 (PDIA6–GFP 5x) and 16,150 (mock-transfected) cells were counted (i). Mean and standard deviation. j,k, Cell viability of PDIA6-knockdown cells, of PDIA6–GFP WT (pink) and PDIA6–GFP 5x linker mutant (grey) transfected cells relative to mock-transfected cells by MTT (PDIA6-siRNA1: **P = 0.003, PDIA6-siRNA2: ***P = 0.00008, two-sided t-test)(n = 9, triplicates of three independent biological experiments; j) and trypan blue assay (PDIA6-siRNA1: ** p = 1.64·10−8, PDIA6-siRNA2: *** p = 0.0004, two-sided t-test) (n = 9, triplicates of from three independent biological experiments; k). For the trypan blue assay a total of 90,350 (PDIA6–GFP WT, siRNA1), 76,070 (PDIA6–GFP 5x, siRNA1), 75,040 (mock-transfected, siRNA1), 54,850 (PDIA6–GFP WT, siRNA2), 66,210 (PDIA6–GFP 5x, siRNA2) and 41,530 (mock-transfected, siRNA2) PDIA6-knockdown cells were counted (k). Mean and standard deviation. l, Western blot showing expression levels of PDIA6 and α-tubulin and in non-treated and PDIA6-knockdown (siRNA1 and siRNA2) HeLa cells. Unprocessed blots are available. Source data

References

    1. Anelli, T. & Sitia, R. Protein quality control in the early secretory pathway. EMBO J.27, 315–327 (2008). - PMC - PubMed
    1. Braakman, I. & Bulleid, N. J. Protein folding and modification in the mammalian endoplasmic reticulum. Annu. Rev. Biochem.80, 71–99 (2011). - PubMed
    1. Vincenz-Donnelly, L. & Hipp, M. S. The endoplasmic reticulum: a hub of protein quality control in health and disease. Free Radic. Biol. Med.108, 383–393 (2017). - PubMed
    1. Ellgaard, L., McCaul, N., Chatsisvili, A. & Braakman, I. Co- and post-translational protein folding in the ER. Traffic17, 615–638 (2016). - PubMed
    1. Hebert, D. N. & Molinari, M. In and out of the ER: protein folding, quality control, degradation, and related human diseases. Physiol. Rev.87, 1377–13408 (2007). - PubMed

MeSH terms

LinkOut - more resources