. 2025 Aug 11;16(1):7410.
doi: 10.1038/s41467-025-62697-8.

Unique metabolic regulation of micromeres contributes to gastrulation in the sea urchin embryo

Affiliations

Unique metabolic regulation of micromeres contributes to gastrulation in the sea urchin embryo

Shakson Isaac et al. Nat Commun. .

Abstract

During development, a group of cells called organizers plays critical roles by sending signals to adjacent cells and controlling embryonic and tissue patterning. Recent studies suggest that these inductive cells facilitate the downstream signaling pathways conserved across organisms. However, what makes these cells fundamentally inductive is little understood. In this study, we demonstrate that the micromeres of the sea urchin, one of the known organizers, have distinct metabolic properties compared to the rest of the embryo. The specific metabolic inhibitors for sugar metabolism (2-DG), fatty acid synthesis (cerulenin), and N-linked glycosylation (tunicamycin) compromise micromeres' regulatory capacity, altering the downstream germ layer patterning in the resultant embryos. Notably, the endoplasmic reticulum (ER) asymmetrically localizes during asymmetric cell division, resulting in the enrichment of ER and Wnt protein at the vegetal cortex of micromeres. Metabolic inhibition appears to compromise ER activity in Wnt particle distribution. We propose that the micromere ER is sensitive to specific metabolic regulation, contributing to the inductive signaling activity. This study provides a paradigm of how ER and metabolic regulation contribute to the inductive capability of the cells.


Conflict of interest statement

Competing interests: The authors declare no competing interests.

Figures

Fig. 1
Fig. 1. Metabolomic characterization of micromeres.
A Sample preparation schematic showing a representative whole embryo at the 16-cell stage, just after micromere formation. These embryos were dissociated and separated over a sucrose gradient to generate a micromere-enriched fraction and a non-micromere fraction. The resulting fractions were then processed for Gas Chromatography and Mass Spectrometry analysis (GC-MS). The experiment was performed in triplicate, resulting in six samples. B Partial least squares discriminant analysis (PLS-DA) on the six samples shows a separation of the micromere and non-micromere samples. C Heatmap visualizing the differentially identified metabolites between the micromere and non-micromere samples. Red indicates higher abundance, and blue indicates lower abundance based on the GSEA statistic: −log10(p-value) * sign(log2(FC)). Rows (individual metabolites) were ordered by GSEA score, with each metabolite annotated by a barcode indicating associated pathways. D Significantly enriched pathways in micromeres or non-micromeres are shown with their respective adjusted p-values from GSEA and directionality.
Fig. 2
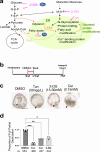
Fig. 2. Inhibitor treatment during the micromere formation compromises gastrulation at Day 2.
a A summary diagram of inhibitor experiments conducted in this study. Metabolites are in blue, enzymes are in green, inhibitors are in brown, and the resultant phenotypes are in red. b An experimental flow of the inhibitor experiments. Each inhibitor was added prior to micromere formation and washed five times with seawater after 30 minutes of incubation. c and d The representative images of 16-cell stage embryos for each treatment group are shown in (c). The proportion of the embryos with micromeres (arrow) is shown in graph (d). A total of 120 embryos were counted for each group. The adjusted p-value between the control (DMSO) and each treatment group is NaN3, p = 0.038; 2-DG, p = 0.32; Cerulenin, p = 0.213. eg The completed gastrulation (stars) and skeleton formation (arrows) are seen in the control and NaN3-treated embryos, while they are compromised in the 2-DG and cerulenin groups (d). The % of embryos fully developed after treatment with various doses of each inhibitor (g) is shown in the graph (f). The total number of embryos scored (n) in each group is DSMO L, n = 92; DMSO M, n = 101; DMSO H, n = 199; NaN3 L, n = 124; NaN3 M, n = 115; NaN3 H, n = 167; 2-DG L, n = 103; 2-DG M, n = 147; 2-DG H, n = 239; Cerulenin L, n = 147; Cerulenin M, n = 213; Cerulenin H, n = 207. The adjusted p-value between the control (DMSO L) and each treatment group is NaN3 L, p = >0.99; NaN3 M, p = 0.12; NaN3 H, p = 0.005; 2-DG L, p = >0.99; 2-DG M, p = <0.0001; 2-DG H, p = <0.0001; Cerulenin L, p = >0.99; Cerulenin M, p = 0.14; Cerulenin H, p = <0.0001. (h) An experimental flow of the rescue experiments. i, j The addition of glucose and palmitic acid (rescue reagents) to 2-DG- and cerulenin-treated embryos, respectively, rescued the developmental failure characterized by the completion of gastrulation (stars) and skeleton formation (arrows) (i). The embryos were pre-treated with each rescue reagent at 1×, 2.5×, or 5× the dose of the corresponding inhibitor, and the percentage of fully gastrulated embryos is shown in the graph (j). DSMO No Res, n = 61; DSMO Res 1×, n = 53; DSMO Res 5×, n = 79; 2-DG No Res n = 119; 2-DG Res 1×, n = 112; 2-DG Res 5×, n = 91; Cerulenin No Res, n = 88; Cerulenin Res 1×, n = 72; Cerulenin Res 5×, n = 54. The adjusted p-value between the control (No Res) and each Res group is Res 1×, p = 0.38; Res 2.5×, p = 0.27; Res 5×, p = 0.34 for the DMSO group, Res 1×, p = <0.0001; Res 2.5×, p = 0.0005; Res 5×, p = 0.0118 for the 2-DG group, and Res 1×, p = <0.0001; Res 2.5×, p = 0.0003; Res 5×, p = 0.0002 for the Cerulenin group. Across the experiments in this figure, the dose of each inhibitor is directly indicated in the image or the graph. Individual dots in the column of graphs suggest an independent cycle of experiments. All graph data are presented as mean values ± SD. Significant results from One-way ANOVA (d, f) or Mixed effects analysis (j) with Dunnett’s multiple comparisons test are shown in each graph. All experiments were performed at least three independent times. All scale bars = 50 μm.
Fig. 3
Fig. 3. Inhibitor-treated micromeres compromise gastrulation and development.
a An experimental flow of the forward micromere transplant. Transplanted micromeres colored by a red fluorescent dye contribute to skeletogenic cells and the PGC in the late-stage embryo. bd The micromere-transplant embryos developed normally in the control group while being delayed and compromised in the 2-DG and cerulenin groups, respectively, as summarized in (d). The transplanted micromeres (red) contribute to skeletogenic cells (arrows) in all groups. Yet, their contribution to the PGC (arrowheads) is apparent only in the control group due to the severe developmental delay/failure in the experimental groups. Over 90% of the transplanted embryos survived in all groups (b). Both no-transplant and micromere-transplant embryos treated with inhibitors showed similar developmental delay or failure with the reduced alkaline phosphatase signal (brown) in the endoderm (stars) (d). e An experimental flow of the reverse micromere transplant. The functional micromeres, colored red, were transplanted to the inhibitor-treated non-micromere host embryos. fh The functional micromere rescued the gastrulation defects to some extent, both in the 2-DG and Cer groups, and the results are summarized in (g). Over 90% of the transplanted embryos survived in all groups (f). Micromere-transplant embryos showed less compromised phenotypes with alkaline phosphatase signal (brown) in the endoderm (stars) compared to no-transplant embryos (h). n in (c) and (h) indicates the total number of embryos scored, and % indicates the proportion of embryos showing the AP signal. Each inhibitor dose used in this study is 30 mM 2-DG and 0.2 mM Cer. These experiments were performed at least two independent times. L. variegatus embryos were used in this figure’s experiments. All scale bars = 100 μm.
Fig. 4
Fig. 4. 2-DG and cerulenin-treated embryos show similar metabolomic profiles in micromeres and later development.
a Schema depicting the experimental procedure for micromere and non-micromere samples. The embryos were exposed to each inhibitor for 30 min at the 8–16-cell stage, respectively, and separated into the micromere and non-micromere fractions by sucrose gradient, followed by metabolomics analysis. b Schema depicting the experimental procedure for whole embryo (WE) samples. The embryos were exposed to each inhibitor (3 mM 2-DG, 0.2 mM Cer, and 1 mM NaN3) for 30 min at the 8–16-cell stage, respectively. The treated whole embryos were collected for metabolomics analysis at the 16-cell stage or Day 2. c Heatmap visualizing correlated effects of different inhibitor treatments across lineage-specific and WE samples using Spearman correlation of fold changes (relative to DMSO control group). d Heatmap visualizing shared pathway responses of inhibitors in the micromere samples. Pathways with nominally significant Spearman correlations (p-value < 0.05) in at least one treatment comparison are shown. Clusters were obtained via hierarchical clustering. e Regression plots showing the correlation of selected pathways between 2-DG and Cer-treated micromeres. Each point is a metabolite with the respective fold change in 2-DG and Cer treatment. Significantly enriched pathways via GSEA identified in each treatment group, with their respective adjusted p-value and directionality, are summarized in the 16-cell (f) and Day 2 (g) embryo groups.
Fig. 5
Fig. 5. Inhibition of N-glycosylation during micromere formation compromises gastrulation at Day 2.
a A summary diagram of the proposed pathways impacted by metabolic inhibitors used in this study. Inhibitors are shown in magenta. Rescue reagents, glucose (Glc) and palmitic acid (PA), are shown in dark blue. bd Schema depicting the experimental procedure for the inhibitor treatment (b). The representative images of Day 2 embryos treated with 0.5 ng/μL tunicamycin (Tun), 0.15 mM cerulenin (Cer), or 15 mM 2-DG during micromere formation (c). An arrow and arrowheads indicate successful gastrulation and failed gastrulation, respectively. The proportion of embryos with successful gastrulation was scored for each treatment group (d). In the graph, the dots in each column indicate biological replicates. The total number of embryos scored (n) in each group is DMSO, n = 554; Tun, n = 408; Cer, n = 247; 2-DG, n = 244. The adjusted p-value between the control (DMSO) and each treatment group is Tun, p = 0.0005; Cer, p = 0.0014; 2-DG, p = 0.014. All graph data are presented as mean values ± SD. Significant results from One-way ANOVA with Dunnett’s multiple comparisons test are shown with asterisks. All experiments were performed at least three independent times. All scale bars in this figure = 50 μm.
Fig. 6
Fig. 6. ER and Wnt localize to the vegetal pole through an asymmetric cell division at the 16-cell stage.
a Immunofluorescence of KDEL, the ER signal sequence (magenta), counterstained with tubulin (green) and DNA (blue). Negative control (Nega. Cont.) was processed without the KDEL primary antibody. Arrows indicate the asymmetric cell division, while an arrowhead indicates the symmetric cell division during the 8–16-cell stages. b Live embryo images of GFP-Wnt5 or -Wnt8 (green; 500–1000 ng/μL stock), counterstained with mCherry-RDEL (magenta) at the 16-cell stage. Arrows indicate the vegetal pole. c, d Live embryo images of the GFP-Wnt5 embryos treated with C59 during imaging (5–6 hpf) or with DMSO, Cer, or 2-DG during micromere formation (4–4.5 hpf). Embryos were counterstained with membrane-mCherry (magenta; 200 ng/μL stock) to outline the cell. The squared regions are enlarged in the bottom row of each panel. GFP-Wnt5 particles (arrows) outside the cell, yet within the hyalin layer or fertilization envelope, were counted for each group and normalized to that of the DMSO control group in graph (d). In the graph, the dots in each column indicate biological replicates. The total number of embryos scored (n) in each group is DMSO, n = 124; Tun, Cer, n = 106; 2-DG, n = 75; C59, n = 50. The adjusted p-value between the control (DMSO) and each treatment group is Cer, p = 0.004; 2-DG, p = 0.007; C59, p = 0.0001. The graph data is presented as mean values ± SD. Significant results from One-way ANOVA with Dunnett’s multiple comparisons test are shown with asterisks. All experiments were performed at least three independent times. All scale bars in this figure = 50 μm.
Fig. 7
Fig. 7. Unique metabolic regulation in micromeres contributes to embryonic patterning.
a Schema depicting the metabolic asymmetry at the 16-cell stage and future germ layer territories, which is altered by each inhibitor treatment. The deeper color indicates more enrichment in the micromere (Mic) or non-micromere (Non-Mic) of the 16-cell stage embryo or expansion of the future germ layer territories. b Proposed Cartoon models summarizing altered embryonic patterning by each inhibitor treatment. In normal embryos, the micromeres signal to adjacent macromeres to facilitate the initial endoderm induction at the 16-cell stage. This initial signaling balances a competition between the future endoderm and the non-skeletogenic mesoderm lineages since cells may be intrinsically inclined to the mesoderm lineage. The micromere descendants then induce the non-skeletogenic mesoderm in the macromere descendants, defining the endoderm territory prior to gastrulation at Day 2. In contrast, the skeletogenic lineage is derived solely from the micromeres under normal conditions. Both 2-DG and Cer reduced the inductive signaling of micromeres, resulting in delayed or compromised endoderm initiation on Day 1 and increased ectoderm or mesoderm at Day 2, respectively. Endo, endoderm. Meso mesoderm. Ecto ectoderm. NSM non-skeletogenic mesoderm. SM skeletogenic mesoderm.

References

    1. Spemann, H. & Mangold, H. U¨ ber die induktion von embryonalanlagen durch implantation artfremder organisatoren. Wilhelm Rouxs Arch. mikrosk. Anat. Entwickl.100, 599–638 (1924).
    1. Boveri, T. Verhandl. Der. Phys. Med. Geselsch. Wurzbg.34, 145–176 (1901).
    1. Horstadius, S. Uber die determination des keimes bei echinodermen. Acta Zool.9, 1–191 (1928).
    1. Horstadius, S. The mechanics of sea urchin development. Annee Biol.26, 381–398 (1950). - PubMed
    1. Horstadius, S. Experimental Embryology of Echinoderms (Clarendon Press, Oxford, 1973).

MeSH terms

LinkOut - more resources