

Improving cardiovascular risk stratification: the role of abdominal obesity in predicting MACEs
- PMID: 40790225
- PMCID: PMC12341332
- DOI: 10.1186/s12933-025-02885-4
Improving cardiovascular risk stratification: the role of abdominal obesity in predicting MACEs
Abstract
Background: Accurate cardiovascular risk (CVR) stratification remains challenging, particularly in identifying individuals with residual risk despite current screening tools. Abdominal obesity reflects visceral adipose tissue, which is metabolically active and strongly linked to pro-inflammatory and atherogenic states. This study aimed to evaluate the predictive utility of baseline cardiometabolic risk factors, with a particular focus on abdominal obesity as quantified by waist circumference (WC), alongside established 10-year CVR scores, for incident Major Adverse Cardiovascular Events (MACEs).
Methods: We prospectively followed 736 outpatients (347 males, 389 females) from an Italian Internal Medicine Unit, initially free of MACEs. Baseline data included anthropometrics, biochemical markers, and calculated Framingham Risk Score (FRS) and SCORE2/SCORE2-OP. Abdominal obesity was defined according to the International Diabetes Federation criteria for Metabolic Syndrome (MetS) as a WC ≥ 94 cm in males and ≥ 80 cm in females. Incident MACEs were recorded during follow-up. Statistical analyses included t-tests, Chi-Square, ANOVA, and logistic regression.
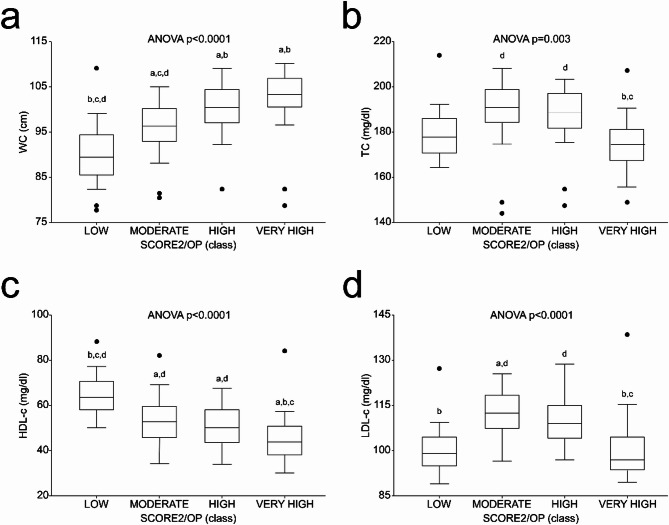
Results: Over a median follow-up of 84.9 months, 132 participants (17.9%) developed MACEs. Baseline abdominal obesity, present in 78.1% of the cohort, was significantly associated with incident MACEs (OR = 1.784, 95% CI = 1.04-3.118, p = 0.038), whereas BMI-defined obesity showed no such association (p = 0.394). Low HDL-cholesterol also emerged as a key predictor (OR = 1.672, 95% CI = 1.115-2.482, p = 0.012). In multivariate logistic regression, adjusted for age and other MetS components, abdominal obesity (OR = 2.2, 95% CI = 1.6-4.2, p = 0.001) and low HDL-c (OR = 1.9, 95% CI = 1.4-3.5, p = 0.001) remained robustly associated with MACEs. Notably, individuals within the SCORE2/SCORE2-OP 'Moderate-Risk' category, despite not being the highest risk overall, exhibited the highest baseline LDL-c levels and accounted for the largest proportion of MACEs (36.4%). Even among participants without baseline abdominal obesity, those who developed MACEs had significantly higher WC (p < 0.0001) and lower HDL-c (p = 0.0078) at baseline.
Conclusion: Abdominal obesity and low HDL-c are potent, independent predictors of cardiovascular events, outperforming traditional markers like BMI. Together with the need of reaching LDL-c serum target levels, these biomarkers are crucial for unmasking the residual risk missed by current stratification models.
© 2025. The Author(s).
Conflict of interest statement
Declarations. Ethics approval and consent to participate: This study was approved by the Ethics Committee (Interdisciplinary Department of Medicine; n. 311, MSC/PBMC/2015, approved on 12 January 2015) of the Azienda Ospedaliero-Universitaria Policlinico di Bari (Bari, Italy) in accordance with the requirements of the Declaration of Helsinki. In accordance with the approved Ethics Committee, only patients who were already 18 years old or older were included. Informed consent was obtained from all subjects involved in the study. Consent for publication: Not applicable. Competing interests: The authors declare no competing interests.
Figures


References
-
- Higashi Y, Sasaki S, Nakagawa K, Matsuura H, Oshima T, Chayama K. Endothelial function and oxidative stress in renovascular hypertension. N Engl J Med. 2002;346(25):1954–62. - PubMed
-
- Herrington W, Lacey B, Sherliker P, Armitage J, Lewington S. Epidemiology of atherosclerosis and the potential to reduce the global burden of atherothrombotic disease. Circ Res. 2016;118(4):535–46. - PubMed
MeSH terms
Substances
Grants and funding
- PE0000015, Concession Decree No. 1243 of 2 August 2022 adopted by the Italian Ministry of University and Research, CUP H33C22000680006, project title "Ageing well in an ageing society-A novel public-private alliance to generate socioeconomic, biomedical and technological solutions for an inclusive Italian ageing society- AGE-IT"/Ministero dell'Università e della Ricerca
- D93C22000890001, project title "ON Foods-Research and innovation network on food and nutrition Sustainability, Safety and Security-Working ON Foods"/Ministero dell'Università e della Ricerca
- IG 2019 "Regulation of lipid metabolic pathways in the gut liver axis: relevance in hepatocarcinoma" Id 23239/Fondazione AIRC per la ricerca sul cancro ETS
- PNRR M6C2-Investimento 2.1 Valorizzazione e potenziamento della ricerca biomedica del SSN", project code PNRR-MR1-2022-12376395. CUP H93C22000780006, project title: Italian Autoimmune Liver Disease (IT-AILD) Clinical Research Network (CRN)/Ministero della Salute
LinkOut - more resources
Full Text Sources
Miscellaneous
